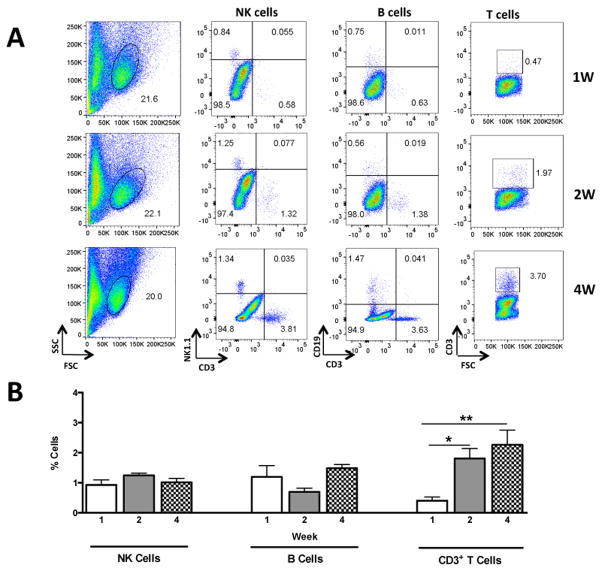
Figure 2.
Representative dot plots from a single mouse showing the time course of lymphocyte expansion in the brain of Rag2−/− mice reconstituted with 10 million lymphoid cells (n = 15 females). A) Representative dot plots outlining lymphoid subsets including NK cells (NK1.1+CD3−), B cells (CD19+CD3−) and T cells (total CD3+) at one, two and four weeks after transfer used for quantifications shown in panel B. * p < 0.05; ** p < 0.01.

