
Figure 5. Stat pathway and caspase1 activation in the kidney of Mer-KO mice with nephritis.
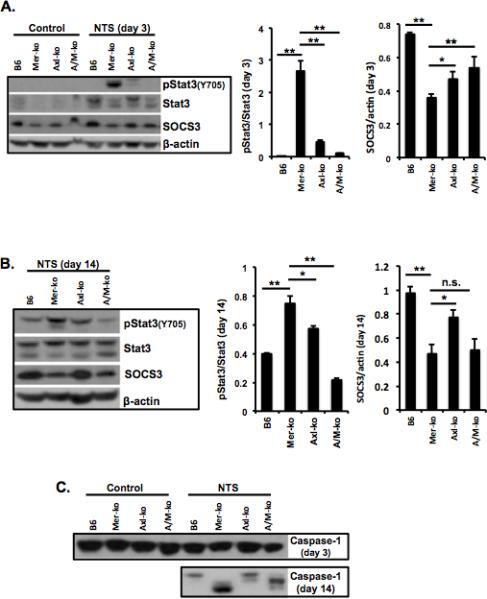
Kidney samples were prepared in RIPA buffer. Analysis of phosphorylation status of Stat3 and expression levels of SOCS3 at day 3 (A) and day 14 (B), and caspase-1 activation (C) during the development of NTS-nephritis was done by Western immunoblotting. Densitometry analysis to quantify ratio of phosphorylated Stat3 to total Stat3 and SOCS3 proteins to β-actin, respectively, is shown at the bottom. Representative Western images are shown. Experiments were independently repeated at least 2 times. Values are expressed as median with interquartile range. Statistical test is the Mann-Whitney test. **p<0.01, *p<0.05.