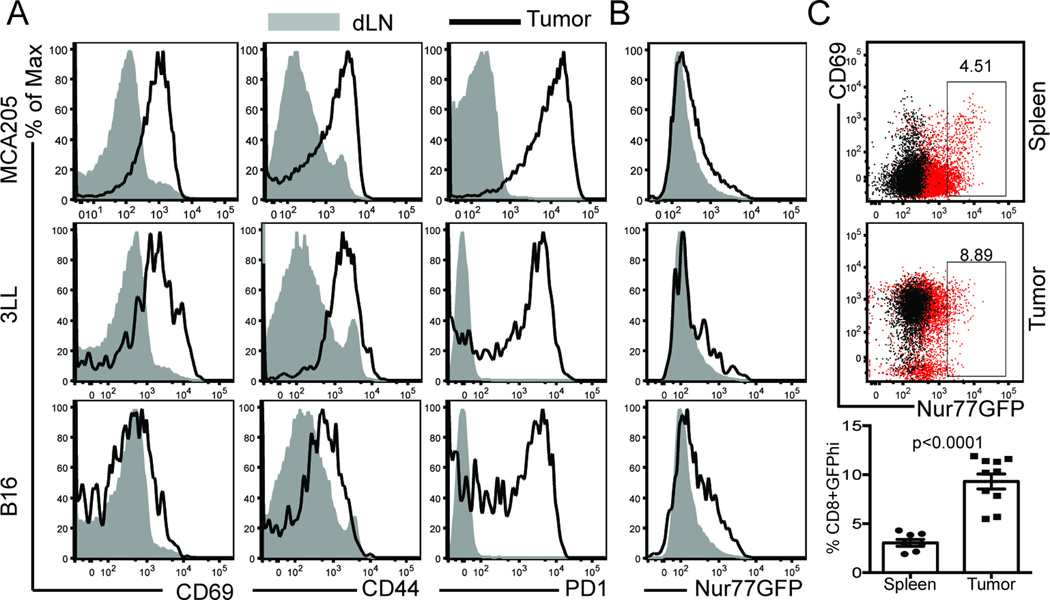
Figure 1. T cell activation markers within the tumor.
A) Traditional markers of T cell activation were assessed on T cells from 3 different tumor models and paired draining lymph nodes 10–14 days after tumor inoculation on the hind flank. B) Nur77GFP expression on these same CD8 T cells was compared to activation molecule expression. C) Frequency of GFPhi CD8 T cells in spleen (top) versus tumor (bottom) of MCA205 tumor bearing mice. Data are representative of more than 6 experiments with n=3 animals per tumor model per experiment. Unpaired two-tailed Student’s t test was used for statistical analysis and mean with SEM is shown.

