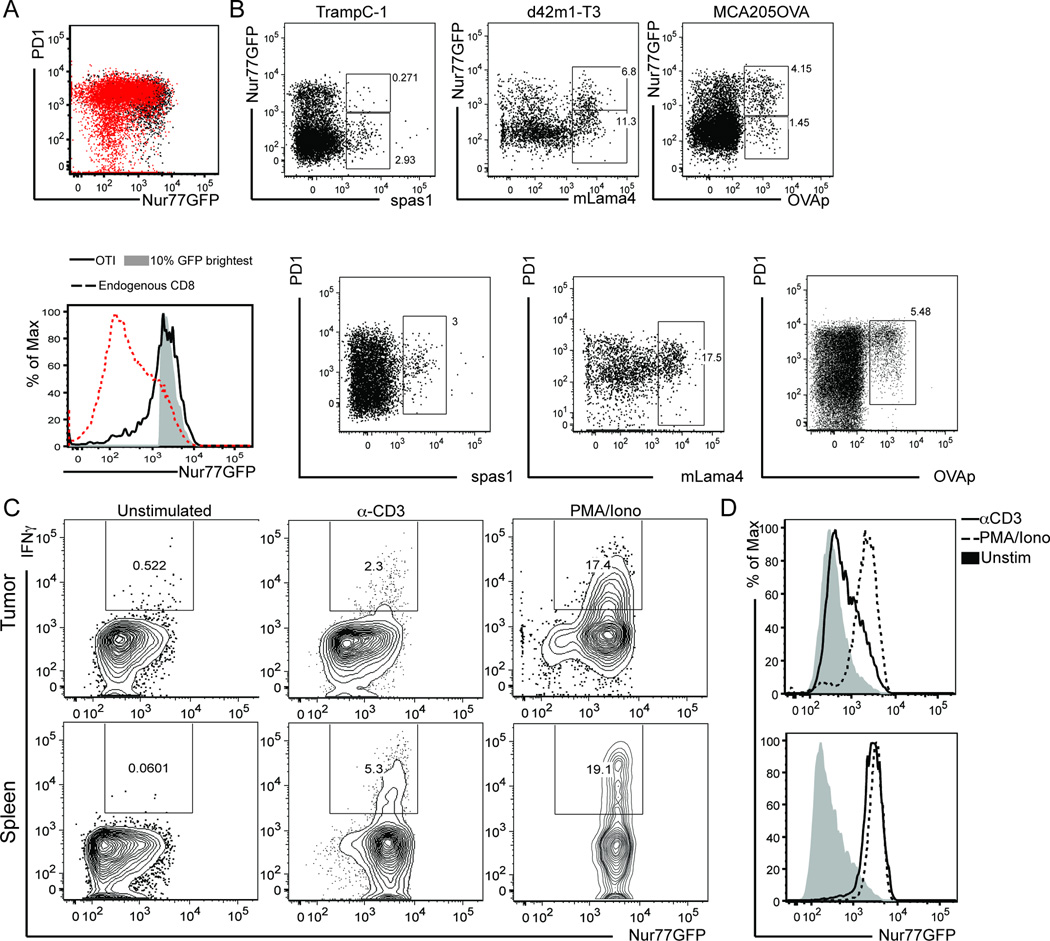
Figure 3. Tumor infiltrating CD8 T cells receive strong TCR signals.
Nur77GFP mice were inoculated with A) MCA205-OVA expressing tumor cells on the hind flank. Once tumors were ~75mm2, 106 OT-I/Thy1.1/Nur77GFP T cells were adoptively transferred (AT). Six days after AT, OT-I T cells were recovered from the tumor and OT-I/GFP expression (black dot plot/solid black line) was compared to the total population of endogenous CD8+ T cells (dotted line) as well as to the brightest GFP+ CD8+ T cells (shaded histogram). Gated on live/TCRβ+/CD8+ for endogenous and live/TCRβ+/CD8+/Thy1.1+ for OT-I histograms. B) Animals were inoculated with TRAMPC-1, d42m1-T3, or MCA205OVA tumor cells in 100µL Matrigel on the hind flank. 5–7 days after inoculation, tumors were harvested and tumor antigen specific T cells identified by MHC I tetramers for known tumor antigens. GFP and PD1 expression was evaluated. C) At ~d14 after MCA205 tumor inoculation in Nur77GFP mice, bulk digested tumor (top) or splenocytes (bottom) were stimulated with anti-CD3 or PMA/Ionomycin for 4 hours before performing intracellular cytokine staining for IFNγ. D) Nur77GFP expression after stimulation in tumor vs spleen. Data shown is representative of 3 experiments with n=4 mice per experiment.

