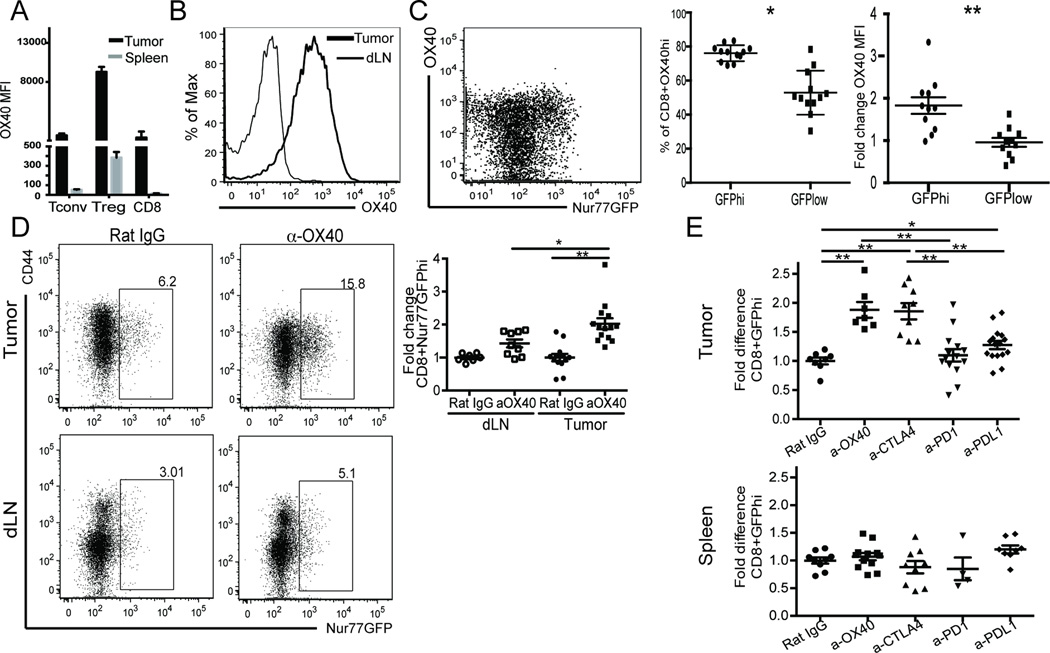
Figure 5. OX40 immunotherapy expands high affinity CD8 T cells.
A) CD4+Foxp3- (Tconv), CD4+Foxp3+ (Treg), and CD8 T cells from tumor and spleen of Foxp3RFP MCA205 tumor-bearing animals were isolated and OX40 MFI evaluated via flow cytometry. Gated on live/TCRβ+/. B) Expression of OX40 on CD8 T cells from the tumor (bold histogram) and spleen (thin histogram) of MCA205 tumor bearing animals. C) Expression of OX40 in Nur77GFP CD8+TIL. The bar graph shows the frequency of OX40+CD8+ within GFP subsets (left) and fold change in OX40 expression of CD8+GFPhi TIL to CD8+GFPlow subset of TIL (right) isolated from MCA205 bearing Nur77GFP mice. D) Nur77GFP MCA205 bearing animals were treated with 2 × 250µg αOX40 or rat IgG control when tumors were ~80mm2 in size. 7d after initiating treatment, TIL were isolated and fold increase in GFPhi T cells over rat IgG was determined. GFPhi gates were determined from a C57BL/6 control **p≤0.05, **p≤0.0001. E) MCA205 tumor bearing GFP mice were treated at day 10 post tumor inoculation with 2 × 250µg rat IgG, α-OX40, or α-CTLA4, or 3 × 200µg α-PD1 or α-PD-L1. All animals were harvested day 7 after therapy was started. Fold change in frequency of GFPhi CD8 T cells as compared to rat IgG control in tumor vs spleen. Data are representative of A-B) 3 experiments, n=4, C) more than 6 experiments n=3, D-E) 3 experiments n=3/group. For two-population comparison, student’s t-test was used and graphed as mean with SEM. Multiple populations were analyzed using one way multiple comparisons ANOVA *p≤0.01, ** p≤0.0001.

