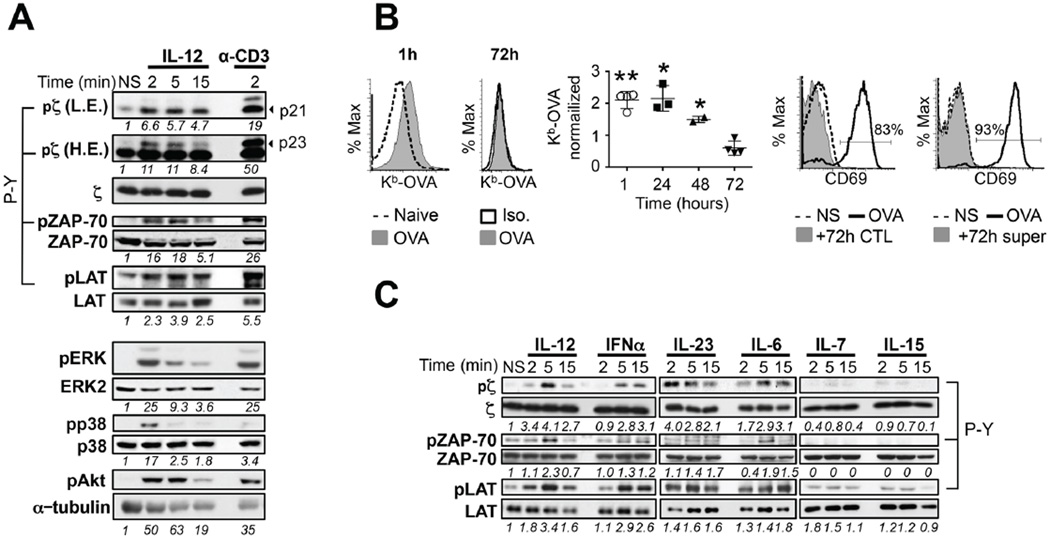
Figure 1. Pro-inflammatory cytokines activate TCR signaling in CD8 T cells.
(A) Day 3 OT-I CTLs were stimulated or not (NS) with 10 ng/mL IL-12 or through the TCR with cross-linked anti-CD3 antibodies for the indicated times. Tyrosine phosphorylation of p21 and p23 forms of CD3ζ (pζ), ZAP-70 (pZAP-70) and LAT (pLAT) was determined by immunoblot with anti-phosphoTyr antibody (4G10 or P-Y). Densitometry values are shown separately for the p21 and p23 forms. Phosphorylation (p-) of ERK, p38 and Akt was determined by immunoblot with antibodies specific for the phosphorylated forms of the kinases. Loading controls were assessed on parallel gels for CD3ζ, ZAP-70 and LAT and on the same membrane after stripping for ERK2, p38 and tubulin. Low (L.E.) and high (H.E.) exposures are displayed for CD3ζ. (B) Histograms for Kb-OVA expression at 1h and 72h OT-1 CTL cultures were obtained upon staining with the Kb-OVA specific antibody 25-D1.16 (Left). OVA peptide bound to H-2Kb expression normalized to non-pulsed OVA T cell cultures is shown in the graph as fold induction (Middle). Naive congenic OT-I T cells were co-cultured with day 3 OT-I CTLs or supernatant from day 3 OT-1 CTL cultures for 3 hours. CD69 expression was measured on naïve congenic OT-1 cells by flow cytometry. CD69 expression of OT-1 naïve cells stimulated with 20 nM OVA is shown as a positive control. Data are representative of n≥ 3 independent experiments. (C) Day 3 Polyclonal CTLs were purified by magnetic bead enrichment and stimulated or not with 10 ng/mL of the indicated cytokine or 5000 U/mL IFNα for the indicated time. Immunoblots were performed as in (A). CD3ζ, ZAP-70 and LAT loading controls as in (A). Shown are representatives of n=3–9 experiments per cytokine. Densitometry values of phosphorylated protein normalized to total protein and relative to their respective NS controls are shown below the panel. All graphs show mean±SD. * p < 0.05 or **p= 0.005.

