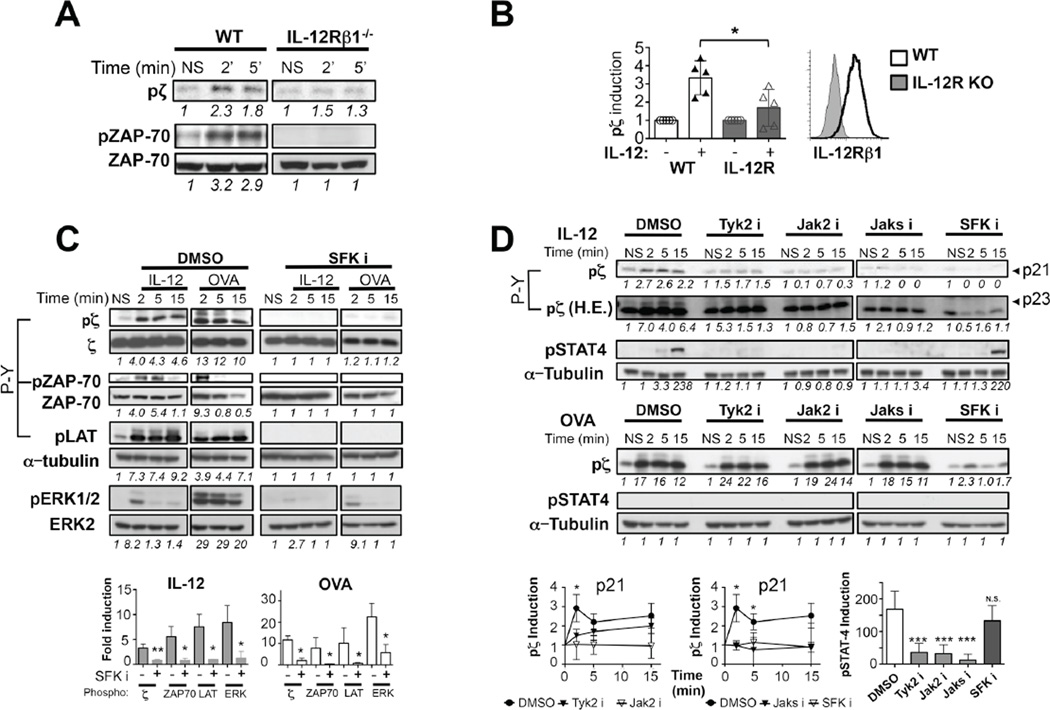
Figure 2. IL-12-dependent TCR signaling requires IL-12R and both, Janus and Src Family Kinase activities.
(A–B) Day 3 OT-I or OT-IxIL12Rβ1−/− CTLs were stimulated or not (NS) with 10 ng/mL IL-12 for indicated times. Tyr phosphorylation of p21 and p23 CD3ζ and ZAP-80 was determined by immunoblot with P-Y, 4G10 antibody. Loading controls were determined in a parallel gel. IL-12Rβ1 expression was assessed by flow cytometry. (C,D) OT-I CTLs were pre-treated with DMSO vehicle control, or inhibitors to SFK (SFKi, 10 µM PP2), Jak2 (100 µM Jak2 i), Tyk2 (100 µM Tyk2 i), or both kinases (50µM each, Jaks i). Then T cells were stimulated or not (NS) with 10 (C) or 1 ng/mL IL-12 (D) or Kb-OVA tetramer for indicated times and levels of pζ, pZAP-70, pLAT, pERK1/2 and pSTAT4 were determined by immunoblot with 4G10 antibody. Tubulin loading controls (C, D) were performed on the same membrane. CD3ζ and ZAP-70 blots in (C) were determined in a parallel gel. Densitometry values for the phosphorylated p21 and p23 forms of CD3ζ are shown in (D). Graphs depict densitometry data for phosphorylated protein relative to their respective NS controls, normalized to loading control. Data is shown for specific time points: 2 minutes (ζ, & ERK), 5 minutes (ZAP-70) or 15 minutes (LAT and STAT4) upon IL-12 stimulation. All graphs show mean±SD. Data is representative of 3–6 independent experiments. * p < 0.05, ** p=0.005 and ***p=0.0005.

