
Figure 4. SERRS signal intensity comparison between nodes of healthy control animals versus PC-3 cell-infiltrated nodes.
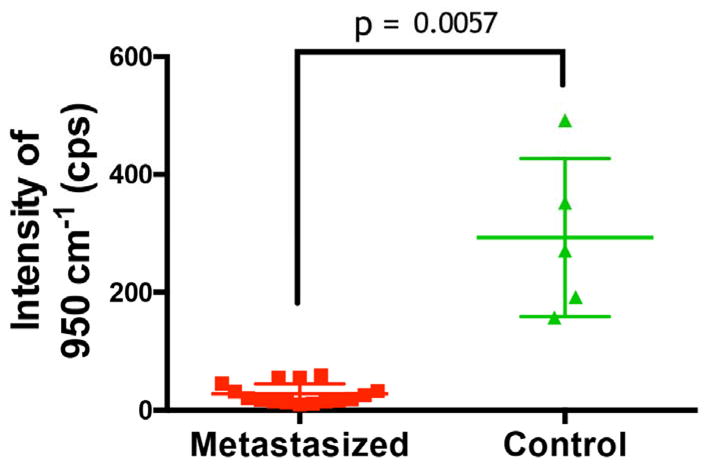
Lymph nodes were identified in healthy control and prostate cancer bearing animals. For each the average intensity of the 950 cm−1 band after baseline subtraction was recorded. Metastasized lymph nodes showed distinctly lower Raman signal than healthy controls, which was statistically significant with a p-value of 0.0057.