
Figure 6. Evaluation and immunological correlates of CD19+CD25high B cells in vaccinated and SIVmac251 infected animals.
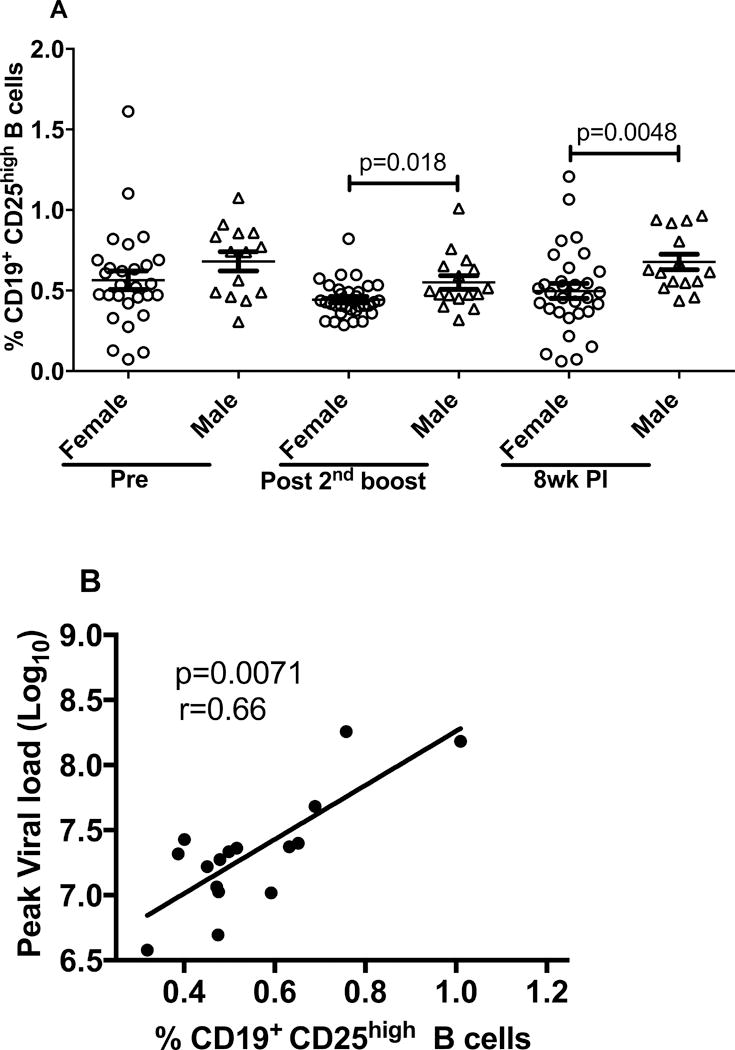
(A) PBMC were obtained at the indicated time points for flow analysis. The post-2nd boost sampling was 3 days following the immunization. (B) Correlation analysis of CD19+CD25high B cells in all immunized males 3 days post-2nd boost with peak viral load. Data presented are means ± SEM.