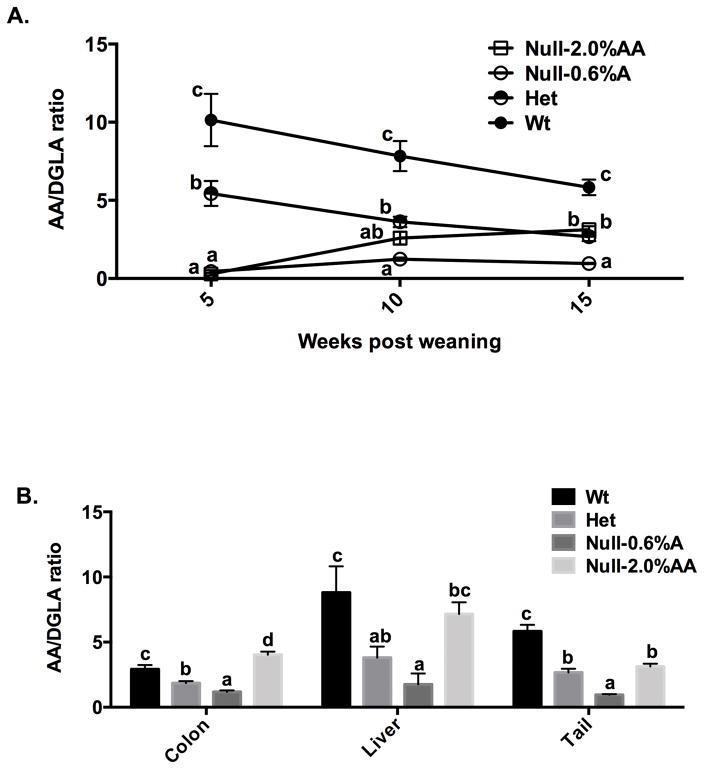
Figure 2. AA/DGLA ratios in AA-supplemented Fads1 null mice.
Post weaning (5 wk old) Fads1 Wt, Het and Null mice were fed an AA-free diet, while Null–0.6% AA and Null–2% AA mice were fed diets supplemented with 0.6 and 2% AA (w/w), respectively, for 10 weeks. (A) Total lipids were isolated from mouse tails at the initial (5 wk of age), mid (10 wk of age) and end (15 wk of age) of the feeding period. Different letters at the same time point indicate significantly differences (P < 0.05), mean ± SE, n=4–10 mice per data point. (B) Total lipids were isolated from colonic mucosa, liver and tail, and fatty acid profiles were measured by GC-MS at the end of the feeding period (15 wk of age) (mean ± SE, n=3). Bars not sharing the same letter indicate a significant difference within respective tissues (P < 0.05).

