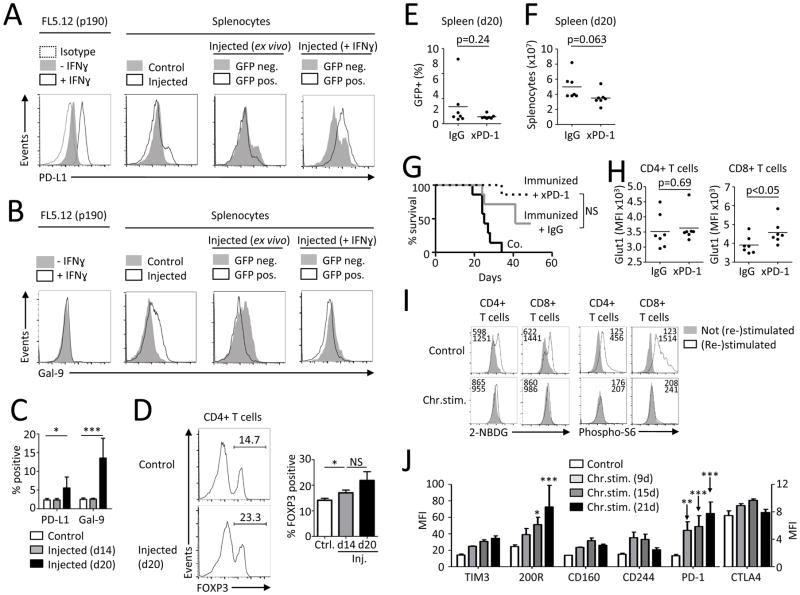
FIGURE 2. Leukemia associated T cell dysfunction is correlated with immunosuppressive micro-environment but can be recapitulated by chronic in vitro stimulation.
(A,B) Expression of PD-L1 and Gal-9 on FL5.12 cells in vitro and on splenocytes from control mice (n=2) or injected mice (n=5) ex vivo or after over-night culture with or without IFNγ. (C) Expression of PD-L1 and Gal-9 on control splenocytes (n=6) or splenocytes from mice 14 days (n=3) or 20 days (n=4) after injection of FL5.12 cells. (D) FOXP3 expression in CD4+ splenic T cells from control mice (n=2) or injected mice (n=3/group) analyzed by flow cytometry. (E–H) BALB/c mice were immunized with low dose (0.02×10⁶) irradiated BCR/Abl FL5.12 cells seven days prior injection of live cells. After injection of leukemic cells, mice were treated with i.p. administration of PD-1 blocking antibody (250 μg/mouse) every three days for the course of 12 days. Splenic T cells were analyzed 20 days after injection. Percentage of GFP+ cells in spleen (E) and total splenocyte count (F) on day 20. (G) Survival of FL5.12 injected mice without treatment (n=7), immunized and IgG isotype treated (n=7) and immunized and anti-PD-1 treated (n=7). (H) Glut1 expression on T cells from animals treated as in E–G was measured with flow cytometry. (I,J) Purified healthy human blood T cells were repeatedly stimulated with low-dose anti-CD3, anti-CD28, anti-CD2 coated beads for indicated times with or without rest until re-stimulation on day 21 (Supplemental Fig. 3B). Glucose uptake, pS6 on CD4+ and CD8+ T cells (I) and expression of specified markers on CD4+ T cells (J) was measured with flow cytometry. Data in C,D are mean ± s.d. * P < 0.05, ** P < 0.01 and *** P < 0.001. Differences in survival were analyzed using Log-rank (Mantel-Cox) test. Data in I are representative of 4–7 chronically stimulated and 4–6 control PBMCs samples. Data in J are mean +/− s.e.m. from 3 donors.

