
Figure 7. Bubble-induced strain simulation.
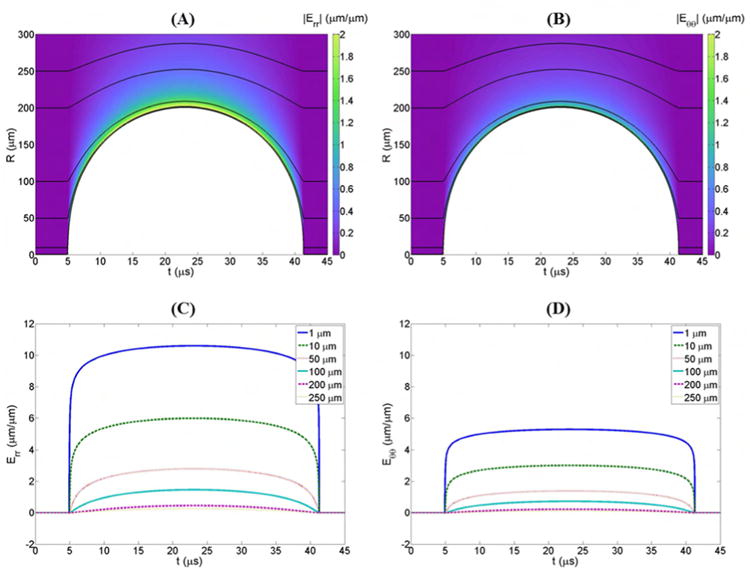
Color plots show the magnitudes of (A) radial and (B) polar strains produced during the expansion of a single histotripsy bubble. To more clearly contrast strain magnitudes, the absolute value of the radial strains is plotted. Black lines show the trajectories, r(t) of particles starting at various distances, r* from the bubble nucleus. Plots of the magnitudes of (C) radial and (D) polar strains experienced by particles moving along these trajectories demonstrate a significant decrease in strain with increasing distance from the bubble.