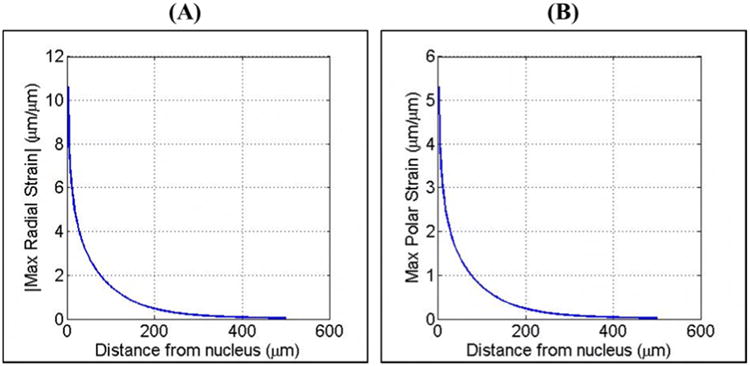
Figure 8. Bubble simulation: Maximum Strain vs. Distance.

Plots show the maximum (A) radial and (B) polar strains produced during the expansion of a single bubble for points located 0 μm-500 μm from the initial nucleus of a bubble expanded to a Rmax of ∼200 μm. Results demonstrated an exponential decrease in maximum strain with increasing distance from the bubble.
