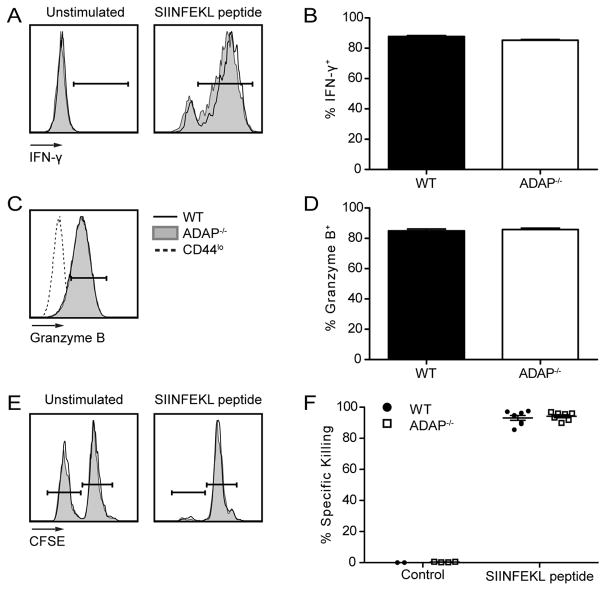
Figure 2. Development of effector functions in CD8 T cells is independent of ADAP.
LM-OVA challenged mice were generated as in Figure 1. Splenocytes were isolated and stained for cell surface markers and intracellular proteins on day 7 post LM-OVA challenge. (A–B) Splenocytes were stimulated ex vivo with SIINFEKL peptide for 5 hours. (A) IFN-γ staining of unstimulated (left) and SIINFEKL stimulated (right) WT (black) and ADAP−/− (grey shaded) OT-I T cells. Gate indicates cells that are positive for IFN-γ. (B) Percentage of IFN-γ+ WT (black bar) or ADAP−/− (white bar) OT-I T cells in the spleen, based on the gate shown in A. (C) Granzyme B staining of WT or ADAP−/− OT-I T cells, or CD44lo host cells (dashed line). (D) Percentage of Granzyme B+ WT or ADAP−/− OT-I T cells in the spleen, based on the gate shown in C. (E–F) WT (CD45.2) or ADAP−/− (CD45.2) OT-I T cells were transferred into separate CD45.1 hosts, and challenged with LM-OVA. On day 7 post challenge, an in vivo killing assay was performed as described in Materials and Methods. Spleens were harvested 5 hours after transfer of targets and specific killing was determined. (E) Representative target frequencies from hosts containing WT or ADAP−/− OT-I T cells. (F) Percentage specific killing. The results (B, D and F) are compiled from at least 2 independent experiments with 4 mice per experiment (± SEM).

