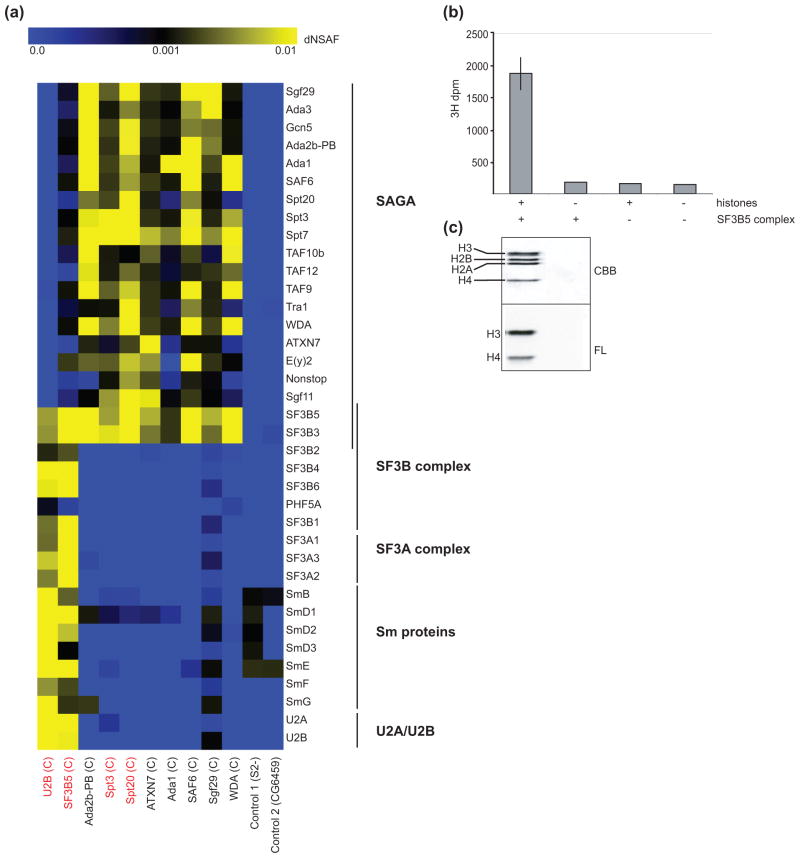
Fig 1. SF3B3 and SF3B5 are novel components of Drosophila SAGA.
(a) Heat map showing the relative spectral abundance of SAGA and spliceosomal subunits expressed as dNSAF (distributive normalized spectral abundance factor) in tandem FLAG-HA purifications from S2 cells using U2B, SF3B5, Ada2B-PB, Spt3, Spt20, ATXN7, Ada1, SAF6, Sgf29 and WDA as bait proteins, relative to control purifications from untagged S2 cells (S2 -) or S2 cells expressing non-specific tagged protein CG6459. Bait proteins were C-terminally tagged as indicated (C). Bait proteins new to this study are highlighted in red. The dNSAF scale is shown at the top of panel (a) with the highest abundance subunits represented in yellow, and absent or under-represented subunits in blue. dNSAF values used to generate the heat map are provided in Supplemental Table S1. (b, c) The HAT activity of FLAG-purified SF3B5-complexes was assayed in vitro by incorporation of 3H-acetyl CoA into core histones. Core histones and/or FLAG-purified SF3B5-complex were included in each HAT assay as indicated by +/− below the graph in panel b, and 3H-acetyl CoA incorporation assayed for each reaction using both scintillation counting (b) and fluorography (c). Lanes in panel (c) correspond to reactions from above (panel b). Reactions containing complex and histones were performed in triplicate and compared to background levels of single control reactions lacking histones or complex as part of the set of HAT assays previously described for WDA- and SAF6-purified SAGA [40]. Error bars in panel (b) for + SF3B5-complex + histones represent standard deviation of the mean for three technical replicates. (c) Histones were separated by SDS-PAGE, stained with Coomassie Brilliant Blue (CBB) to determine the migration of each histone (upper panel), and 3H-acetyl CoA incorporation for each histone examined using fluorography (FL).

