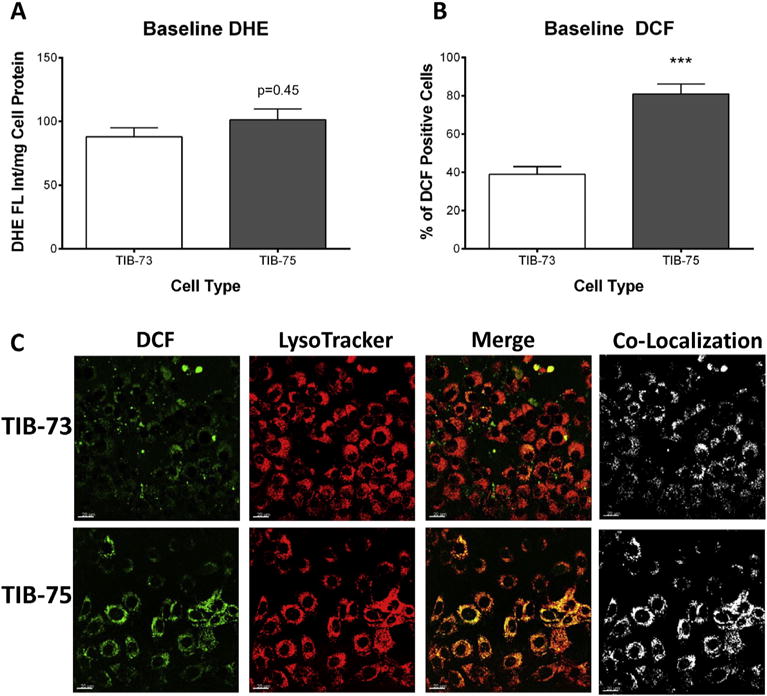
Fig. 3. Baseline oxidative stress.

(A) Spectrofluorometry of TIB-73 and TIB-75 cells dyed with 10 μM DHE normalized to cell protein. There was not a significantly higher amount of superoxide levels in TIB-75 cells compared to TIB-73 cells at baseline (p-value = 0.45, n = 3). (B) Flow cytometry of TIB-73 and TIB-75 cells dyed with 15 μM DCF-DA to determine ROS generation. TIB-75 cells had higher DCF fluorescence than TIB-73 cells at baseline (p-value = 0.0008, n = 3). (C) Confocal imaging (40× magnification) of TIB-73 and TIB-75 cells incubated for 30 min with 50 nM LysoTracker Deep Red and 10 μM DCF. Images were deconvoluted prior to analysis to determine signal co-localization. The Manders coefficient for the co-localization of DCF with LysoTracker is 0.14 ± 0.02 and 0.27 ± 0.04 (p-value = 0.007) for TIB-73 and TIB-75, respectively.
