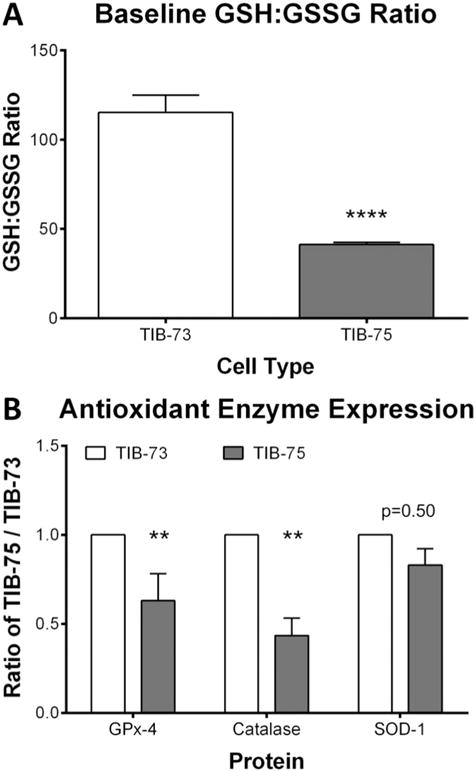
Fig. 4. Baseline glutathione levels and antioxidants defenses.

(A) GSH and GSSG levels of TIB-73 and TIB-75 cell pellets were determined using an enzymatic recycling method. TIB-75 cells had a significantly lower GSH:GSSG ratio compared to TIB-73 cells (p-value < 0.0001, n = 5). (B) Antioxidant protein levels from TIB-73 and TIB-75 cell lysates were determined by Western Blot and normalized to β-actin protein. SOD-1 protein expression was not significantly different (p-value = 0.50, n = 8), but TIB-75 cells had significantly lower GPx-4 (p-value = 0.004, n = 10) and catalase (p-value =0.009, n = 5) protein expression compared to TIB-73 cells. * = p-value ≤ 0.05, ** = p-value ≤ 0.01, *** = p-value ≤ 0.001, **** = p-value ≤ 0.0001. The error bars represent the standard error of the mean.
