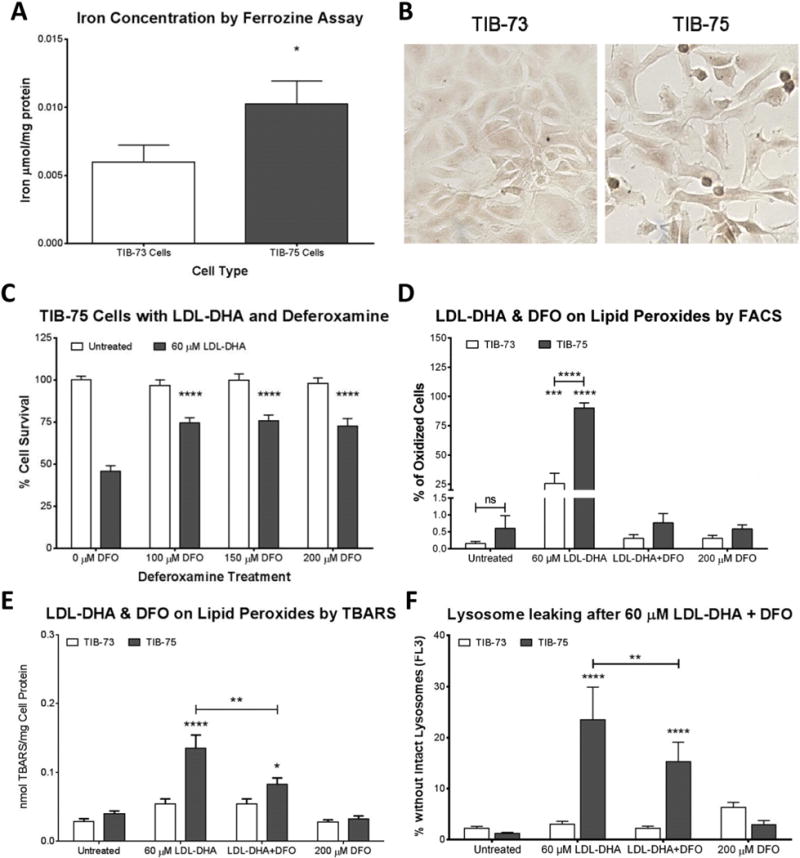
Fig. 7. Iron determination in TIB-73 and TIB-75 cells.

(A) Iron determination in cell lysates by the colorimetric ferrozine assay. Iron concentration of each sample was determined by comparison to a FeCl3 standard curved and normalized to protein (n = 3). (B) Labile iron was visualized in TIB-73 and TIB-75 cells by silver sulfide autometallography (the images above were developed for 10 min). The slides were imaged using a brightfield microscope at 20× magnification. TIB-75 cells displayed a higher amount of silver sulfide staining compared to TIB-73 cells. In the following figures (C–F), cells were serum-starved, pretreated for 3 h with the iron chelator deferoxamine, and then 60 μM LDL-DHA was added for 24 h. (C) Cell viability of TIB-75 cells. Pretreatment with deferoxamine to remove labile iron partially rescued LDL-DHA cytotoxicity in TIB-75 cells (n = 7). (D) Flow cytometry of TIB-73 and TIB-75 cells stained with 1 μM BODIPY C11 581/591 prior to treatment. TIB-75 cells had a higher percentage of cells with oxidized lipids following LDL-DHA treatment and that lipid oxidation was removed with deferoxamine pretreatment (n = 5). (E) TBARS of TIB-73 and TIB-75 cells after treatment. Deferoxamine pretreatment to remove labile iron significantly reduced lipid peroxidation caused by LDL-DHA in TIB-75 cells, but not back to baseline levels (n = 9). (F) Flow cytometry of TIB-73 and TIB-75 cells after treatment and staining with 0.5 μg/mL acridine orange for 15 min. Decreased red acridine orange fluorescence (FL2) of the cells was measured by flow cytometry to determine the number of cells with loss of intact lysosomes. Deferoxamine pretreatment was able to significantly increase the number of TIB-75 cells with intact lysosomes following LDL-DHA treatment (n = 9). * = p-value ≤ 0.05, ** = p-value ≤ 0.01, *** = p-value ≤ 0.001, **** = p-value ≤ 0.0001. The error bars represent the standard error of the mean.
