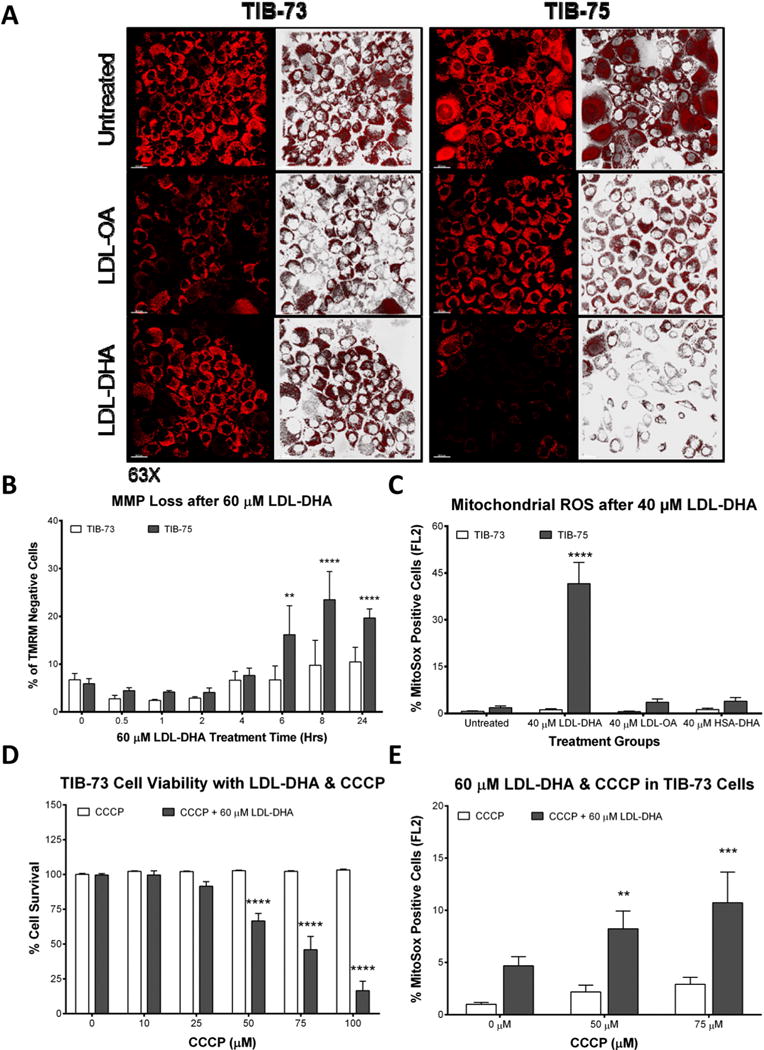
Fig. 8. LDL-DHA causes selective mitochondrial dysfunction in TIB-75 cells.

(A) Confocal images (63× magnification) of TIB-73 and TIB-75 cells after treatment with serum free media or 60 μM of LDL-OA or LDL-DHA overnight, 200 nM TMRM for 25 min, and then 50 nM TMRM for imaging. Bright punctate fluorescence indicates normal/hyperpolarized mitochondrial membrane potential and dim fluorescence indicates abnormal/depolarized mitochondrial membrane potential. (B) Flow cytometry of TIB-73 and TIB-75 cells treated for different time periods with 60 μM LDL-DHA and stained with 100 nM TMRM for 15 min. TIB-75 cells had a higher percentage of TMRM negative cells following LDL-DHA treatment that increased with time compared to TIB-73 cells (n = 7). (C) Flow cytometry of TIB-73 and TIB-75 cells treated with serum free media, 40 μM LDL-OA, LDL-DHA or HSA-DHA overnight and then 5 μM MitoSox and 0.2 μM MitoTracker Green for 15 min. TIB-75 cells had a higher percentage of MitoSox positive cells following LDL-DHA treatment compared to TIB-73 cells. LDL-OA and HSA-DHA did not significantly increase MitoSox expression in either cell line (n = 3). For Figs. D and E, TIB-73 cells were pretreated for 1 h with CCCP (0–100 μM) followed by 60 μM LDL-DHA for 24 h (D) or overnight (E). (D) Cell viability of TIB-73 cells after CCCP and LDL-DHA treatment. Inhibition of mitochondrial oxidative phosphorylation by CCCP sensitized TIB-73 to a sub-lethal dose of LDL-DHA in a dose-dependent manner (n = 9). (E) Flow cytometry of TIB-73 cells stained with 5 μM MitoSox and 0.2 μM MitoTracker Green for 15 min after CCCP and LDL-DHA treatment. Pretreatment with CCCP increased the number of MitoSox positive cells following treatment with LDL-DHA compared to the untreated control group (n = 5). * = p-value ≤ 0.05, ** = p-value ≤ 0.01, *** = p-value ≤ 0.001, **** = p-value ≤ 0.0001. The error bars represent the standard error of the mean.
