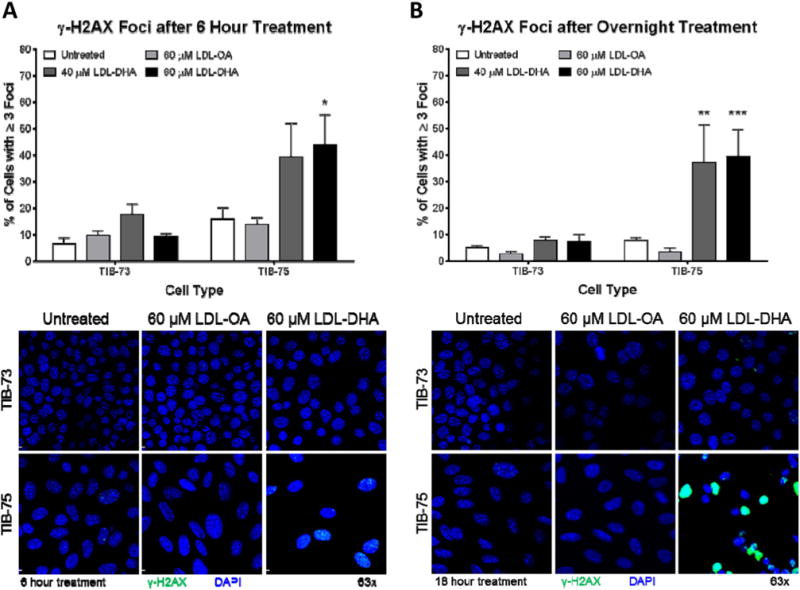
Fig. 9. γ-H2AX foci formation after LDL-DHA treatment.

Confocal images (63× magnification) of γ-H2AX stained TIB-73 and TIB-75 cells after treatment for (A) 6 h or (B) overnight with serum free media, 40 μM LDL-DHA, 60 μM LDL-DHA or 60 μM LDL-OA. Images were analyzed on Imaris imaging software and the total number of cells and cells containing ≥3 γ-H2AX foci were counted using ImageJ software (n = 5). * = p-value ≤ 0.05, ** = p-value ≤ 0.01, *** = p-value ≤ 0.001, **** = p-value ≤ 0.0001. The error bars represent the standard error of the mean.
