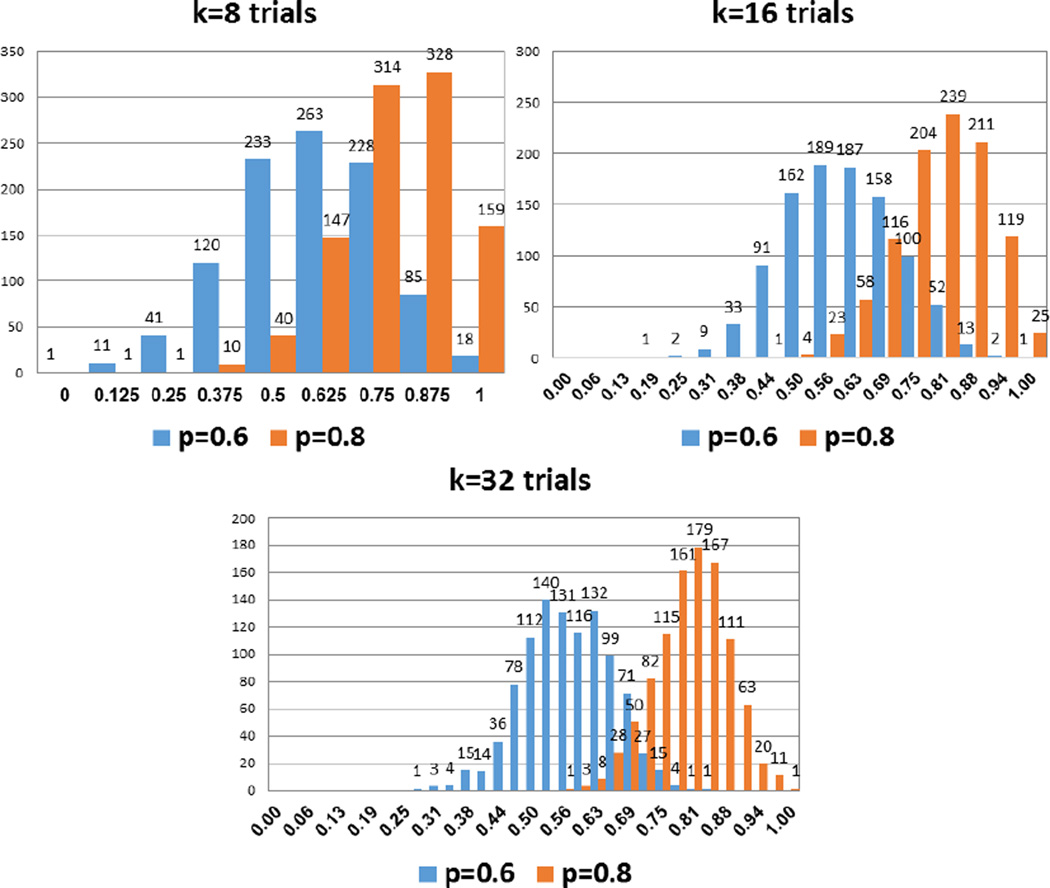
Figure 2.
Distribution of scores for two individuals that differ in their probability to identify triplets in the test phase (p=0.6 and p=0.8), in tests with 8, 16 and 32 trials, over a simulation of 1000 iterations. As the number of trials increases, the overlap between the distributions decreases and the test better discriminates between the two individuals.

