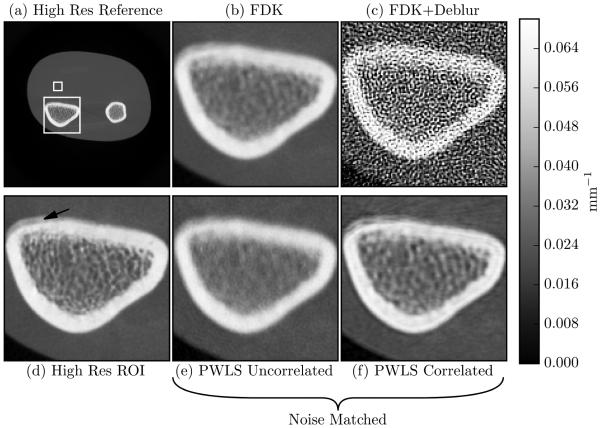
Figure 10.
Test-bench data reconstructions. (a) High resolution reference image. The large box denotes the ROI used for (b-f). (b) FDK reconstruction. (c) FDK reconstruction on deblurred data. (d) High resolution reference image with an arrow indicating cartilage-equivalent plastic. (e) Reconstruction obtained using the uncorrelated noise model. (f) Reconstruction obtained using the correlated noise model and noise matched with (e).

