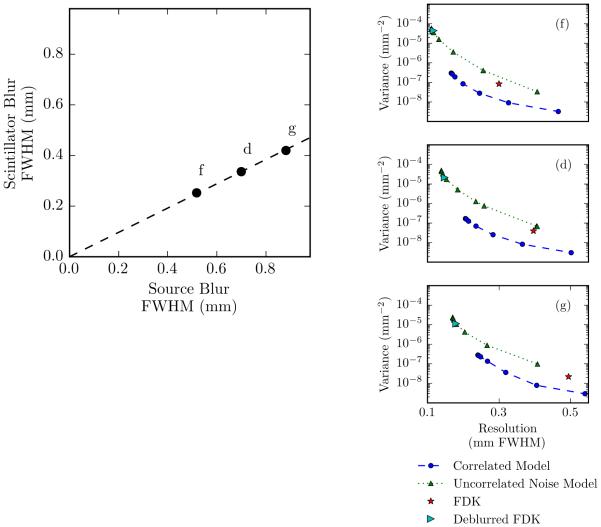
Figure 8.
Performance evaluation of correlated and uncorrelated models for PWLS reconstructions under varying total blur conditions. The points in the top figure show three different system scenarios, each with the same ratio of source to scintillator blur. The different total system blur conditions represented by points f, d, and g correspond to the resolution-variance plots on the right.

