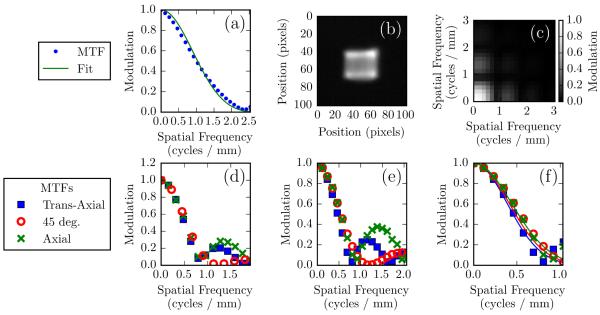
Figure 9.
(a) Detector MTF measurements and parameterized fit. The model used for fitting was a Gaussian multiplied by a sinc function. (b) Focal spot image from the CBCT test-bench. (c) A source MTF derived from the focal spot image approximately scaled for focal spot blur at the center of rotation. (d) Trans-axial, axial, and 45° profiles of the pinhole-derived source MTF. (e) Source MTFs as estimated from edge responses at the center of rotation. f) Zoomed version of (e), with solid lines indicating the corresponding profiles of the parameterized fit.

