Figure 2.

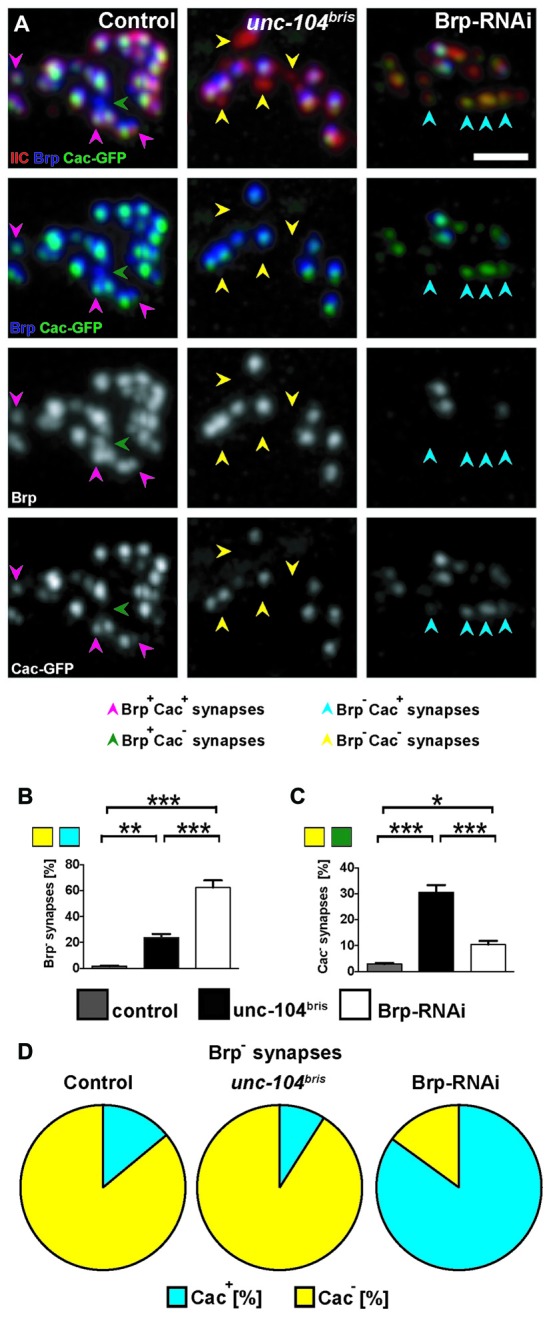
Cacophony (Cac) at the NMJ of unc-104bris mutant and Brp-RNAi expressing larvae. (A–C) Pattern of Cac clustering observed by expressing GFP-tagged Cac (Cac-GFP) at the active zones (AZs) in control, unc-104bris and Brp-RNAi larvae (A). Brp− synapses in unc-104bris animals are also devoid of Cac-GFP (yellow arrowheads). In contrast, Brp− synapses in Brp-RNAi animals are mostly Cac-GFP positive (blue arrowheads). (B,C) Quantifications of the percentages of Brp− and Cac-GFP negative (Cac−) synapses. (D) Pie-charts showing the proportion of Brp− synapses that are Cac-GFP positive (Cac+) and Cac−. Genotypes in (A): control (elavX-Gal4/+;;UAS-Cac-GFP/+), unc-104bris (elavX-Gal4/+;unc-104bris/unc-104d11024;UAS-Cac-GFP/+), Brp-RNAi (elavX-Gal4/+;;UAS-Brp-RNAi/UAS-Cac-GFP). Experiments were performed at 29°C. Scale bar: 2 μm. Statistical test: one-way ANOVA followed by Tukey’s Multiple Comparison Test. *p < 0.05; **p < 0.01; ***p < 0.001. Error bars represent SEM.
