Figure 3.
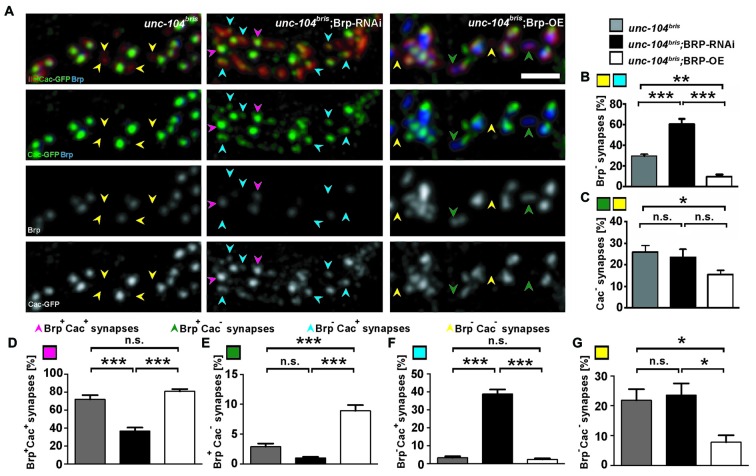
Impact of varying Brp levels on presynaptic Brp and Cac in unc-104bris background. (A) A stretch of synaptic boutons at the NMJ costained with antibodies against GluRIIC (red, upper panel) and Brp (blue in upper panel, gray in 3rd panel). Cac was visualized by expression of Cac-GFP (green in 2nd panel, gray in lower panel). Mutant unc-104bris NMJs are characterized by frequent absence of both Brp and Cac-GFP (yellow arrowheads). The frequency of Brp− synapses increases in unc-104bris; Brp-RNAi and decreases in unc-104bris; Brp-OE NMJs, however, the availability of Cac-GFP does not follow the same trend. (B,C) Quantifications of the percentage of Brp− (B) and Cac− (C) synapses as shown in (A). (D–G) Quantifications of the percentages of Brp+Cac+ (magenta arrowheads in A,D), Brp+Cac− (green arrowheads in A,E), Brp−Cac+ (blue arrowheads in A,F) and Brp−Cac− (yellow arrowheads in A,G) synapses. Genotypes in (A): unc-104bris (elavX-Gal4/+;unc-104bris/unc-104d11024;UAS-Cac-GFP/+), unc-104bri;Brp-RNAi (elavX-Gal4/+;unc-104bris/unc-104d11024;UAS-Brp-RNAi/UAS-Cac-GFP), unc-104bri;Brp-OE (elavX-Gal4/+;unc-104bris/unc-104d11024;UAS-Brp/UAS-Cac-GFP). Experiments were performed at 29°C. Scale bar: 2 μm. Statistical test: one-way ANOVA followed by Tukey’s Multiple Comparison Test. *p < 0.05; **p < 0.01; ***p < 0.001; n.s. p > 0.05. Error bars represent SEM.

