Figure 4.

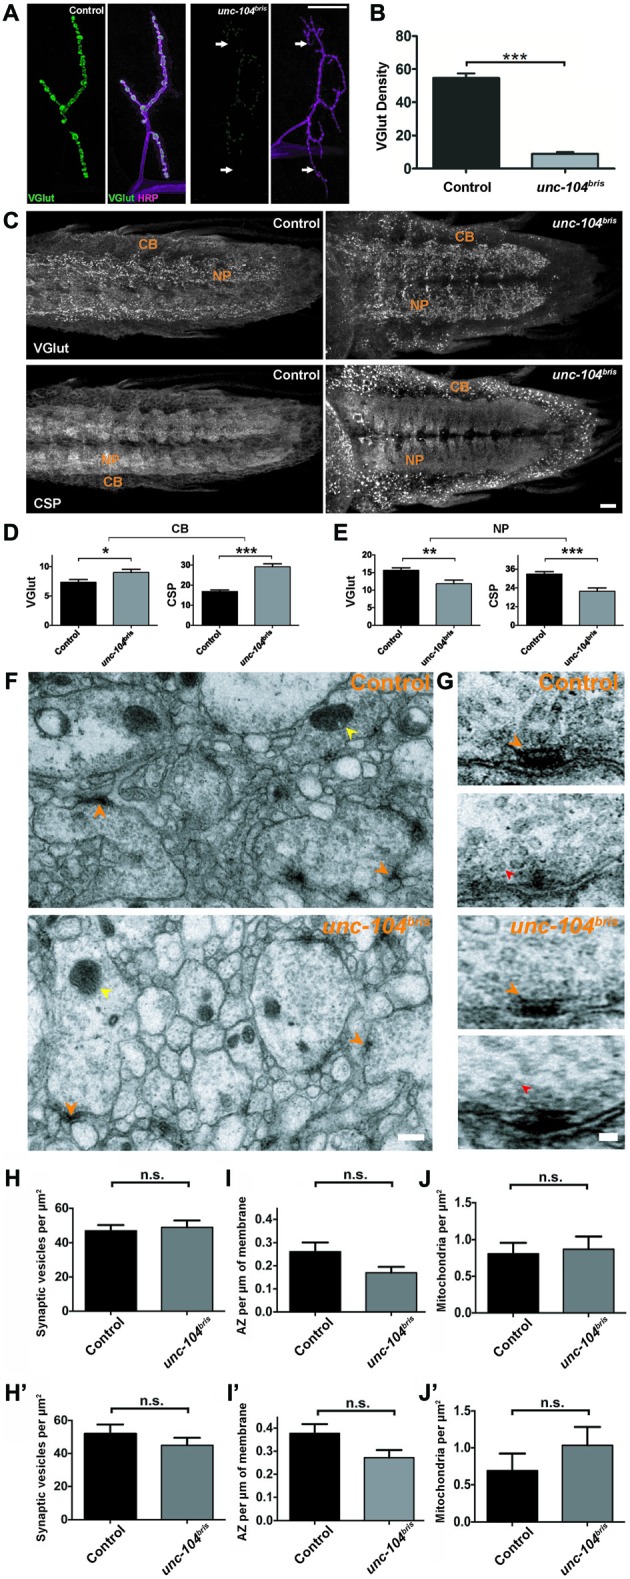
Characterization of impaired transport at the NMJ and ventral nerve cord (VNC) in unc-104bris mutants. (A) Representative confocal images of NMJs from control and unc-104bris mutant larvae stained with antibody against vescicular glutamate transporter (VGlut, green in A). Neuronal membranes were visualized using horseradish peroxidase (HRP) staining (magenta in A). (B) Quantification of VGlut at the NMJs shown in (A), per HRP area (VGlut density; control: 54.70 ± 2.75 a.u.; unc-104bris: 8.92 ± 1.04 a.u., p < 0.001). Experiments were performed at 29°C. (C) Representative confocal images showing abnormal accumulation of VGlut and cysteine string protein (CSP) in the cell body (CB) region of the larval VNC in unc-104bris compared to control larvae. (D,E) Quantifications of the intensities of VGlut and CSP (in a.u.) in the CB and neuropil (NP) region of the VNC in control and unc-104bris larvae. VGlut intensity at the CB (control: 7.37 ± 1.40 a.u.; unc-104bris: 9.017 ± 1.71 a.u., p < 0.05), CSP intensity at the CB (control: 16.91 ± 2.46 a.u.; unc-104bris: 29.117 ± 4.80 a.u., p < 0.001), VGlut intensity at the NP (control: 15.61 ± 2.25 a.u.; unc-104bris: 11.79 ± 3.46 a.u., p < 0.01), CSP intensity at the NP (control: 32.85 ± 4.77 a.u.; unc-104bris: 21.865 ± 6.58 a.u., p < 0.001). (F,G) Representative electron micrographs showing the NP region of VNCs from control and unc-104bris larvae (F) and two representative T-bars from control and unc-104bris mutant larval VNC each (G). (H–J) Quantifications of synaptic vesicles (SVs; red arrowheads), AZs (orange arrowheads) and mitochondria (yellow arrowheads) at the VNCs in control and unc-104bris larvae in (F). n > 40, n represents number of cells analyzed. (H′–J′) Quantifications of SVs, AZs and mitochondria at the VNCs in control and unc-104bris larvae with analysis only limited to boutons with the presence of a synapse. n > 40, n represents number of cells analyzed. Genotypes: control (w1118), unc-104bris (;unc-104bris/unc-104d11024;). Scale bar in (A): 10 μm, (C): 10 μm, (F): 0.3 μm, (G): 0.1 μm. Experiments were performed at 25°C. Statistical test: Student’s t test. *p < 0.05; **p < 0.01; ***p < 0.001; n.s. p > 0.05. Error bars indicate the SEM.
