Figure 5.
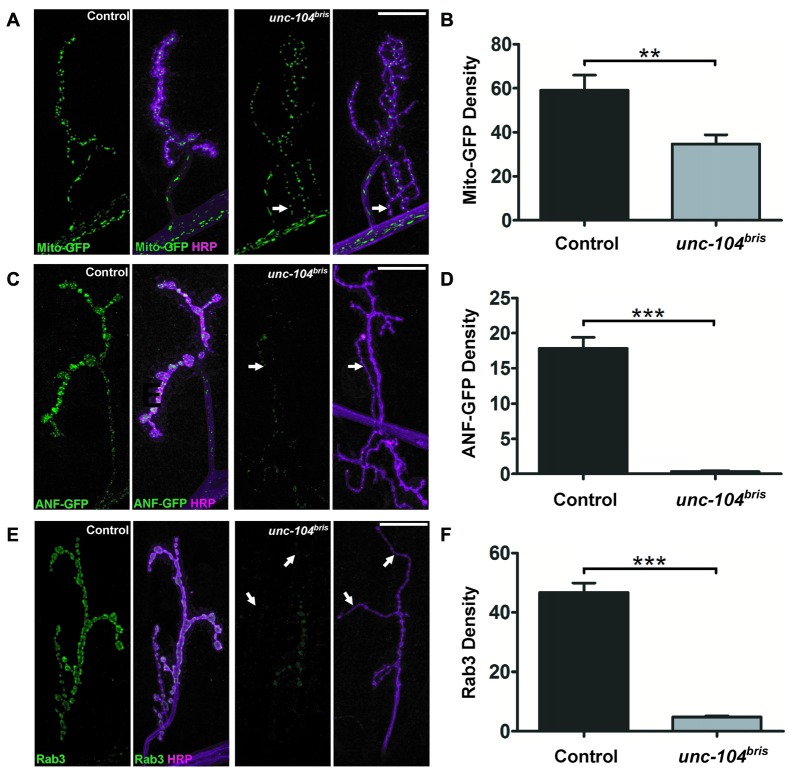
Synaptic abundance of different cargoes at the NMJ of unc-104bris mutants. Confocal images of NMJs in control and unc-104bris mutant larvae expressing mito-GFP (green, in A) or dense core vesicle (DCV) marker GFP tagged atrial natriuretic factor (ANF-GFP; green, in C) induced by the D42-Gal4 driver. (A) mito-GFP localization was only mildly affected in unc-104bris mutant NMJs (per HRP area; Mito density). (C) In contrast, ANF-GFP was barely present in unc-104bris mutant NMJs (per HRP area; ANF-GFP density) compared to control NMJs (per HRP area). Quantifications (in a.u.) of mito-GFP (B) and ANF-GFP (D) per HRP area respectively as seen in (A,C). Mito-GFP abundance in unc-104bris mutant NMJs decreased slightly (control: 59.09 ± 6.84 a.u.; unc-104bris: 34.77 ± 4.13 a.u., p < 0.01) whereas ANF-GFP in unc-104bris mutant NMJs dropped to only 2% of control (control: 17.84 ± 1.56 a.u.; unc-104bris: 0.34 ± 0.10 a.u., p < 0.001). (E) Immunostaining of Rab3 (green in E) reveals that its quantity also decreased significantly at unc-104bris mutant NMJs. (F) Quantification of Rab3 at the NMJs (per HRP area; Rab3 density) shown in (E) in a.u. (control: 46.69 ± 3.25 a.u.; unc-104bris: 4.77 ± 0.46 a.u., p < 0.001). N = 9–13 NMJs in each group. Genotypes: in (A,B) control (;;D42-Gal4, UAS-mito-GFP/+), unc-104bris (;unc-104bris/unc-104d11024;D42-Gal4, UAS-mito-GFP/+); (C,D) control (;;D42-Gal4, UAS-anf-GFP/+), unc-104bris (;unc-104bris/unc-104d11024;D42-Gal4, UAS-ANF-GFP/+); (E,F) control (w1118), unc-104bris (;unc-104bris/unc-104d11024;). Experiments were performed at 29°C. Scale bars: 10 μm. Statistical test: Student’s t test. **p < 0.01; ***p < 0.001. Error bars represent SEM.

