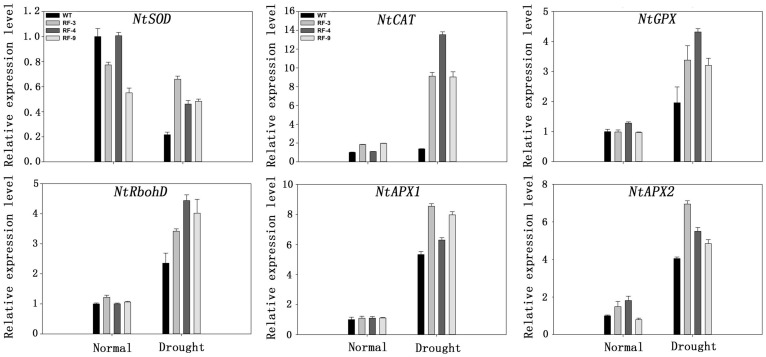
FIGURE 7.
Expression of antioxidant related genes in WT and transgenic plants under drought stress by real-time RT-PCR. Transcript levels of these genes in transgenic plants are indicated relative to the levels in WT plants (set at 1), referring to the transcript of actin in the same samples. Each column represents the average of at least three replicates ± standard error (SE).

