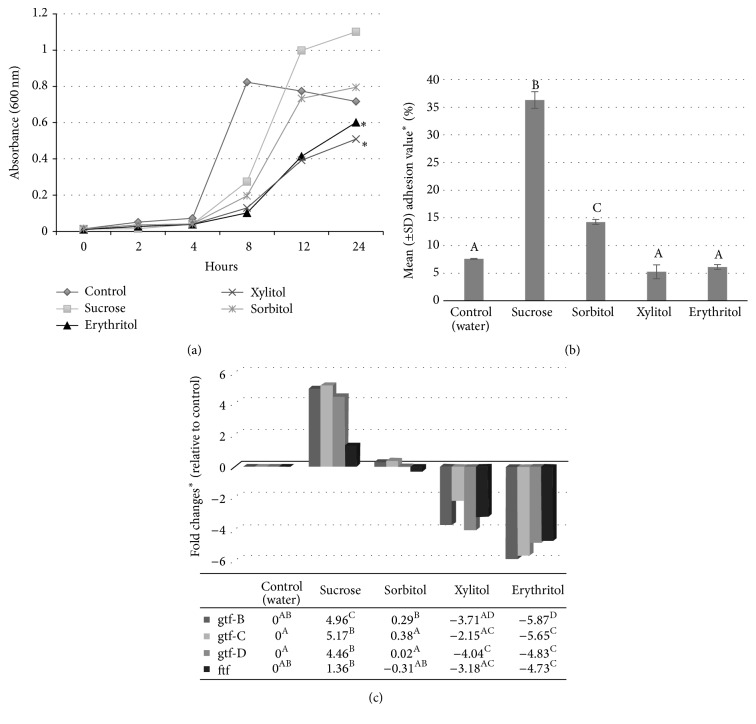
Figure 6.
Growth (a), adhesion (b), and gene expression ((c); gtf and ftf) of S. mutans (strain ATCC 31989) in the presence of 10% sucrose, erythritol, xylitol, or sorbitol (adapted from Park et al. [17]). p < 0.05 when compared to control (water) using analysis of variance (ANOVA) repeated measures (a). SD: standard deviation; overall difference (p < 0.05) based on the Kruskal-Wallis test. A, B, C, DThe same letter indicates no significant difference (p < 0.05) based on Mann-Whitney testing (b). ∗ p < 0.05, based on the Kruskal-Wallis test, A, B, C, Dthe same letter indicates no significant difference based on Mann-Whitney testing (c).

