. 2016 Aug 30;57(6):1435–1445. doi: 10.3349/ymj.2016.57.6.1435

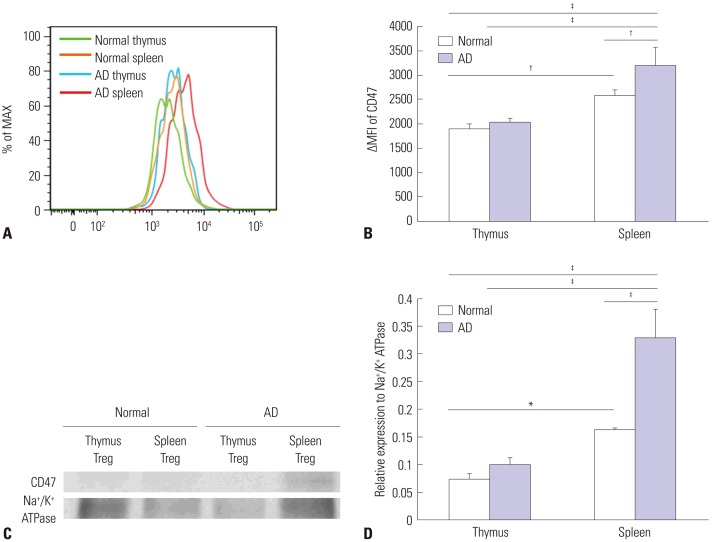
Fig. 3. Increased expression of CD47 in Treg cells from AD mice. (A) FACS analysis of expression of CD47 in Treg cells from thymuses and spleens from normal and AD mice. The ΔMFI of CD47 was determined in Treg cells. The green line indicates CD47 in a normal thymus, the orange line indicates CD47 in a normal spleen, the blue line indicates CD47 in an AD thymus, and the red line indicates CD47 in an AD spleen. (B) CD47 expression was more upregulated in Treg cells isolated from normal spleens than in those isolated from normal thymuses. Moreover, its expression was further upregulated in Treg cells from AD spleens. (C) Western blot analysis of the expression of CD47 on Treg cells from spleens and thymuses of AD mice and normal mice. The expression level of CD47 was similar to the results of the FACS analysis. (D) Western blot densitometry. Differences were determined via one-way ANOVA. For each group, mice n=4. *p<0.05, p<0.01, p<0.001. AD, atopic dermatitis; Treg, regulatory T.

Fig. 3