. 2016 Aug 30;57(6):1461–1467. doi: 10.3349/ymj.2016.57.6.1461

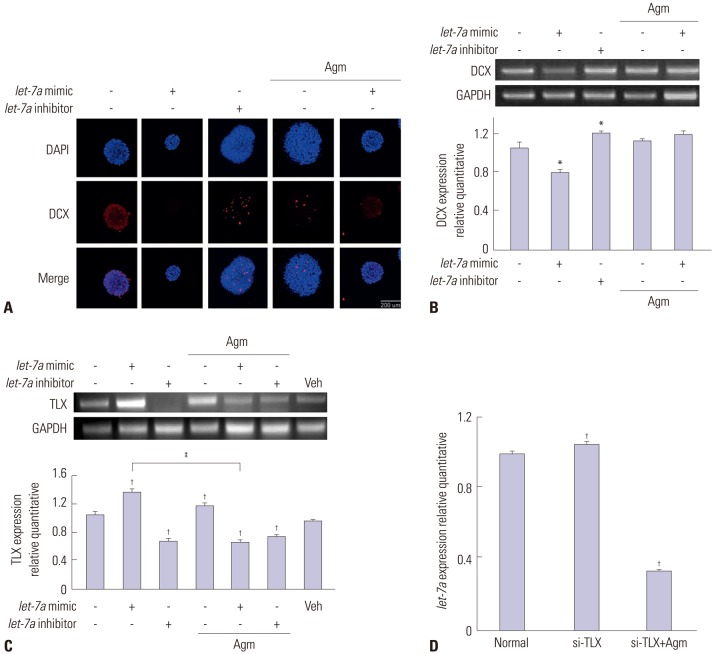
Fig. 3. The expression of DCX and TLX mRNA levels in neural stem cells. (A) Immunochemical images indicated that DCX-positive cells decreased in the let-7a mimic group. Scale bar: 200 µm. NC: the normal control group, 4', 6-diamidino-2-phenylindole (DAPI): blue, DCX: red. (B) Under agmatine treatment, the let-7a suppression group (let-7a inhibitor group) expressed lower DCX mRNA levels. GAPDH was used as an internal control. (C) The let-7a mimic group with agmatine had decreased TLX mRNA expression compared to the let-7a mimic group. GAPDH was used as an internal control. (D) Inhibition of TLX expression by agmatine decreased let-7a levels. U6 was used as an internal control. Data are expressed as mean±SEM. *p<0.05, p<0.001 compared to normal control group, p<0.001 compared to let-7a mimic group. let-7a mimic, let-7a mimic treatment/let-7a overexpression group; let-7a inhibitor, let-7a inhibitor treatment/let-7a suppression group; Normal, normal control group/no treatment; Agm, 100 µM agmatine treatment group; siTLX, TLX silencing group; siTLX+Agm, TLX silencing with agmatine treatment group.

Fig. 3