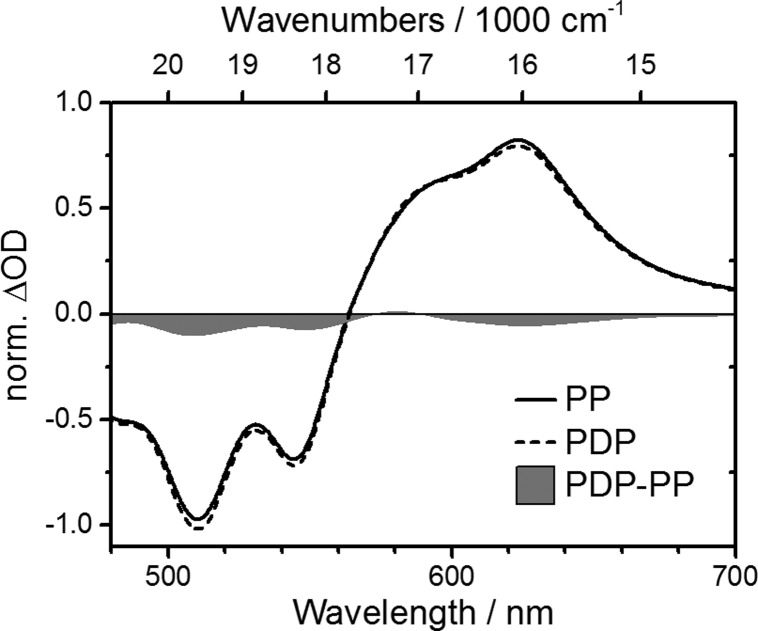
Figure 4.
Effect of depletion at 1000 nm after excitation into S2 for Zea15 model data. The black curves show calculated pump–probe (full line, PP) and pump-deplete-probe (PDP, dashed) at 2 ps pump–probe delay. The depletion pulse was set to arrive simultaneously with the pump-pulse. The filled gray line depicts the difference between the full and the dashed curve. ESA from S2 to higher lying electronic states is not considered.

