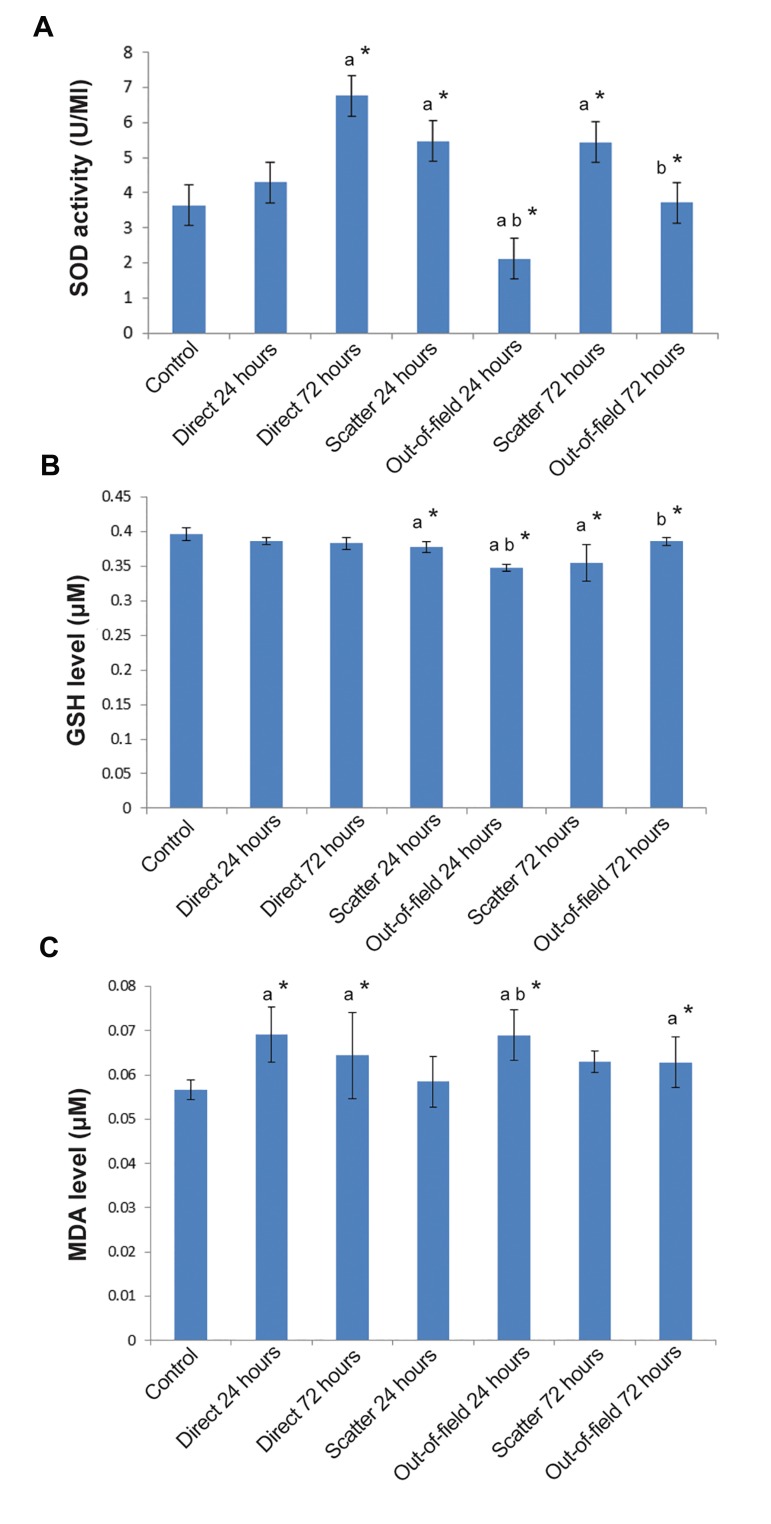
Fig.1.
Changes in oxidative stress markers include SOD activity, GSH and MDA levels in lung tissue. A. SOD activity, B.GSH level, and C. MDA level in the lung tissues in the direct, scatter and out-of-field groups. Direct irradiation and scatter groups were compared to the control group, while out-of-field groups were compared to the scatter groups. a; Values are expressed as a comparison between treatment and control groups, b; Out- of-field groups are compared with scatter groups using Mann- Whitney test, *; P<0.05, SOD; Superoxide dismutase, GSH; Glutathione, and MDA; Malondialdehyde.

