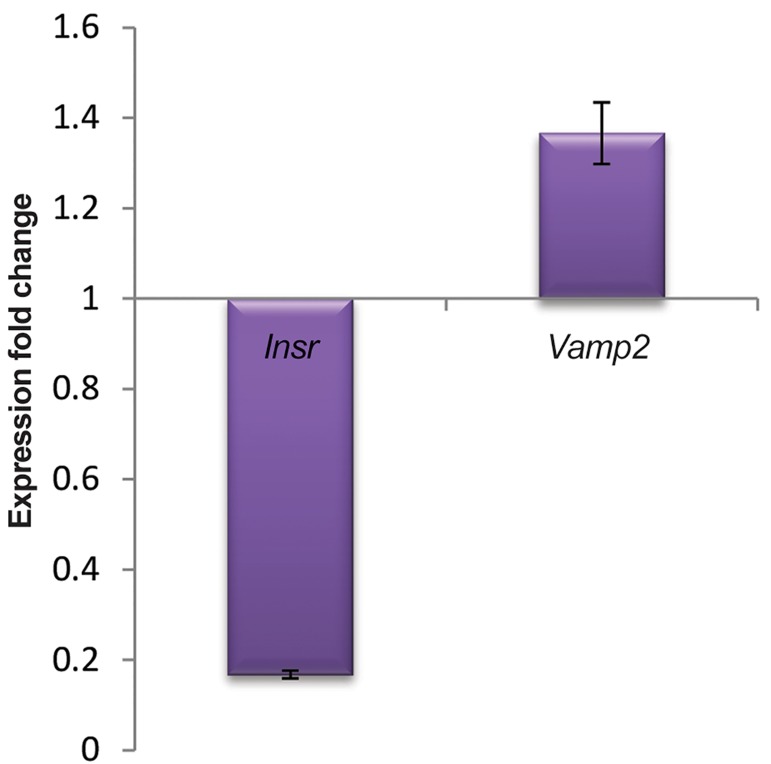
Fig.3.
Expression pattern of the candidate genes during miR-135 transfection. Based on real time (qRT-PCR) results which were concurrent to miR-135 up-regulation in transfected cells, Insr has significant down-regulated profile during differentiation process (P≤0.05). In contrast, no significant overexpression of Vamp2 was observed (P>0.05). Error bars indicate SEM (n=3). qRT-PCR; Quantitive reverse transcriptase-polymerase chain reaction.

