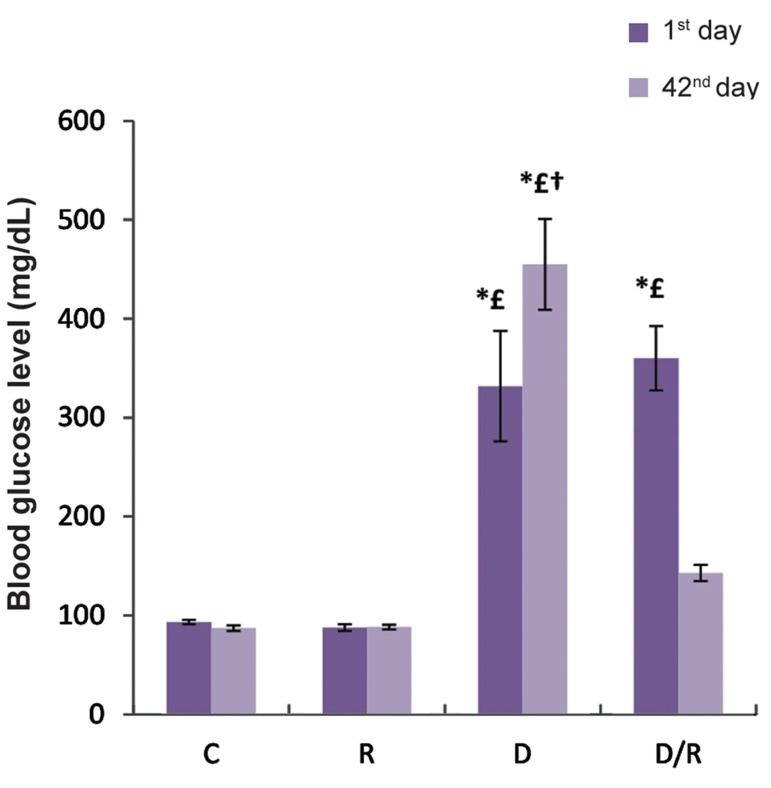
Fig.1.
FBG level (mg/dL) of all groups during the treatment period. Results are presented as mean ± SE. *; P<0.05 as compared to the group C, £; P<0.05 as compared to group R, †; P<0.05 as compared to D/R group, FBG; Fasting blood glucose, SE; Standard error, C; Control group, R; Royal jelly group, D; Diabetic group, and D/R; Royal jelly-treated diabetic group.

