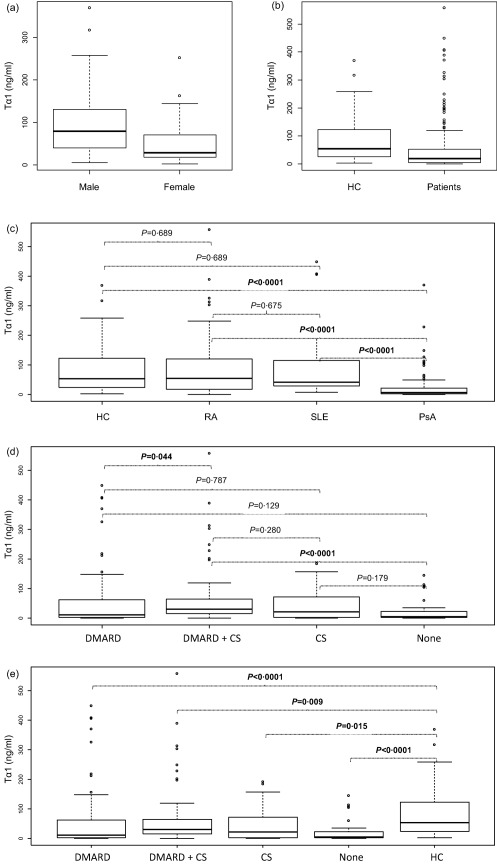
Figure 1.

Data are shown as box‐plots, where each box represents the 25th–75th percentiles. Lines inside the box represent the median value. P‐values were calculated by Mann–Whitney U‐test (comparisons between two groups) or Kruskal–Wallis rank sum test (comparisons between more than two groups). All P‐values for multiple pairways comparisons were adjusted using Benjamini and Hochberg correction 22. Box‐plots represented serum thymosin alpha 1 (Tα1) levels according to gender in HC (a), to HC and patients (b), to the clinical diagnosis (c), to the treatment (d) and by comparing HC towards all treatment groups (e). HC = healthy controls; PsA = psoriatic arthritis; RA = rheumatoid arthritis; SLE = systemic lupus erythemathosus; DMARD = disease modifying anti‐rheumatic drugs; CS = corticosteroids; none = no treatment.
