Figure 1.

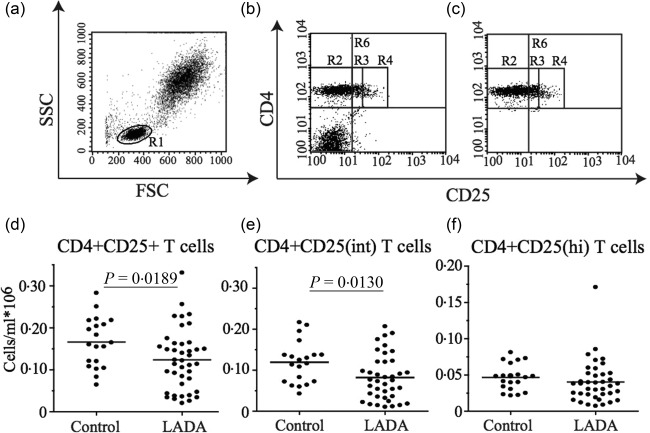
Flow cytometric analysis of T cell populations in whole blood. (a) Gating strategy of the lymphocyte populations. The lymphocyte population (R1) was gated based on its characteristic appearance in forward scatter–side‐scatter (FSC‐SSC). (b) Representative dot‐plots showing the gating for total CD4+CD25+ T cells (R6) and (c) Representative dot‐plots of R6 used to calculate the frequency and total cell numbers of different populations within the CD4+ T cells. The CD4+ T cell population was divided based on the CD25 expression into CD4+CD25– T cells (R2), CD4+CD25int T cells (R3) and CD4+CD25hi T cells (R4). Frequency of total CD4+CD25+ (d), CD4+CD25int (e) and CD4+CD25hi (f) T cells in the 39 of the total 47 LADA patients of which we could performed the analysis on frozen peripheral blood mononuclear cells (PBMC) and healthy control individuals (n = 20). Mean value for each group is indicated with a horizontal line.
