
Figure 2.
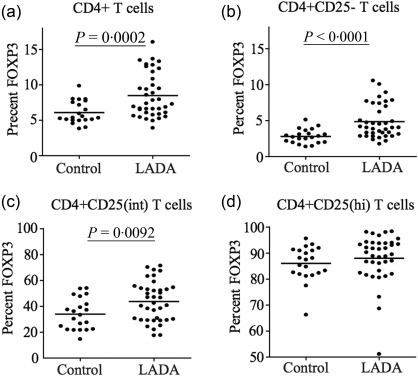
Flow cytometric analysis of forkhead box protein 3 (FoxP3) expression in CD4+ T cells. Percentage of FoxP3 expression in the total CD4+ T cell pool (a), among the CD4+CD25– T cells (b), the CD4+CD25int T cells (c) and the CD4+CD25hi T cells (d) in latent autoimmune diabetes of adults (LADA) patients (n = 38) and healthy control individuals (n = 20). Mean value for each group is indicated with a horizontal line.