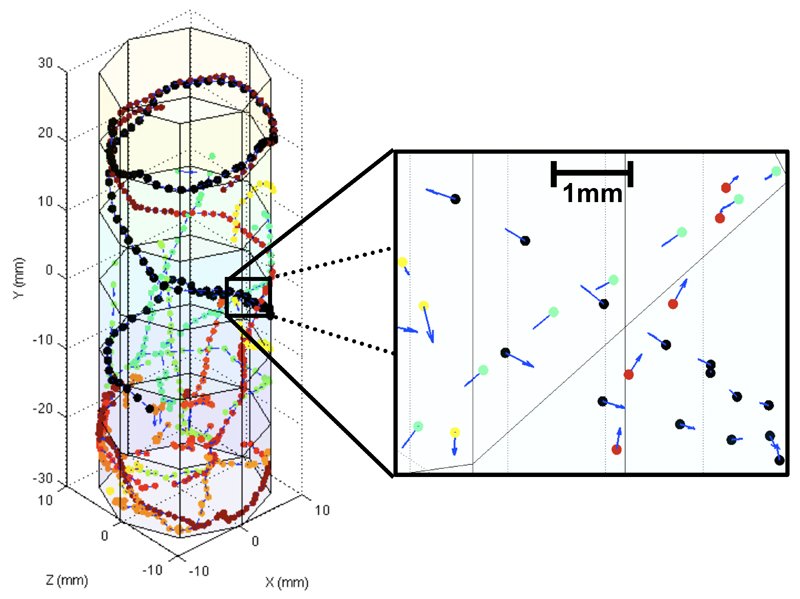
Figure 2. Demonstration of the spatial resolution of the iFly method.
Trajectories are from healthy flies at day 1 after hatching and reconstructed from fly locations determined by the iFly software over a short 7.5s video segment. The fly tube has a radius of 10mm with flies traveling up to 55mm vertically. A section is magnified to provide a close-up on various intersecting fly trajectories. Velocity vectors indicate direction and amplitude of fly locomotion. Fly locations are shown as small colored dots indicating clear separation and a sub-millimeter spatial resolution. For comparison, the length of a fly body is approximately 1.5-2mm.

