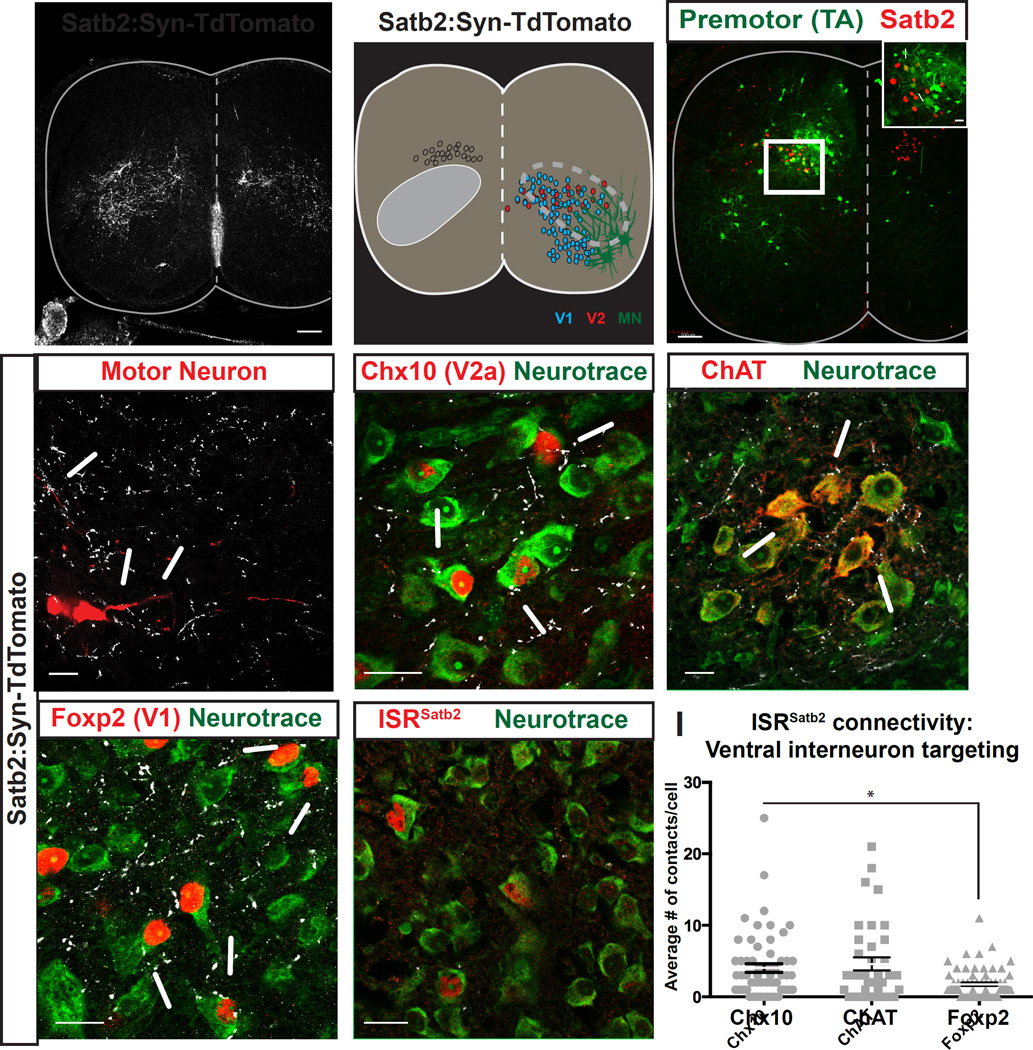
Figure 3. ISRSatb2 neurons synaptically target ventral motor circuitry.
A, B. Presynaptic terminals of ISRSatb2 neurons (A) broadly target the ventral spinal cord, overlapping with a region where components of ventral motor circuitry reside (B). Distribution of presynaptic terminals of ISRSatb2 was identified by genetic labeling (Satb2:Synaptophysin-TdTomato). Left side of spinal cord in B shows ISRSatb2 neuron cell bodies (white) and termination zone of presynaptic terminals (gray oval). Right side of spinal cord in B shows approximate cell body locations of V1 (blue), V2 (red) interneurons, motor neurons (MN, green). Dotted lines encompass the area of dense labeling of presynaptic terminals of ISRSatb2 neurons and the position of ventral neuron populations. C. Satb2 labels a subset of premotor neurons in the deep dorsal horn. Monosynaptically restricted Rabies labeling identifies premotor neurons (green) from tibialis anterior muscles that co-express Satb2 (red). White box in C corresponds to high magnification image shown in inset. Arrows in inset identify yellow cells that are positive for Rabies to identify premotor neurons (green) and Satb2 (red). D-G. ISRSatb2 neurons target cellular components of ventral motor circuitry. High magnification images from the ventral spinal cord showing contacts from presynaptic terminals of ISRSatb2 neurons (white) onto (D) virally labeled motor neurons (red), and onto neurotrace+ cell bodies (green) of (E) Chx10+ V2a interneurons (red), (F) ChAT+ motor neuron cell bodies (red), (G) Foxp2+ V1 interneurons (red). (H) In contrast, presynaptic terminals of ISRSatb2 neurons (white) on neurotrace+ cell bodies (green) were not identified onto ISRSatb2 neurons (red). (I) Quantification of the number of contacts onto ventral interneurons. There are significantly more contacts on ChAT+ motor neurons than on Foxp2+ V1 interneurons. Data points represent individual neurons; averages are represented as mean +/− SEM. See also Figure S3. Scale bars in A, C, 100um. Scale bars in C (inset), D-H, 20um.

