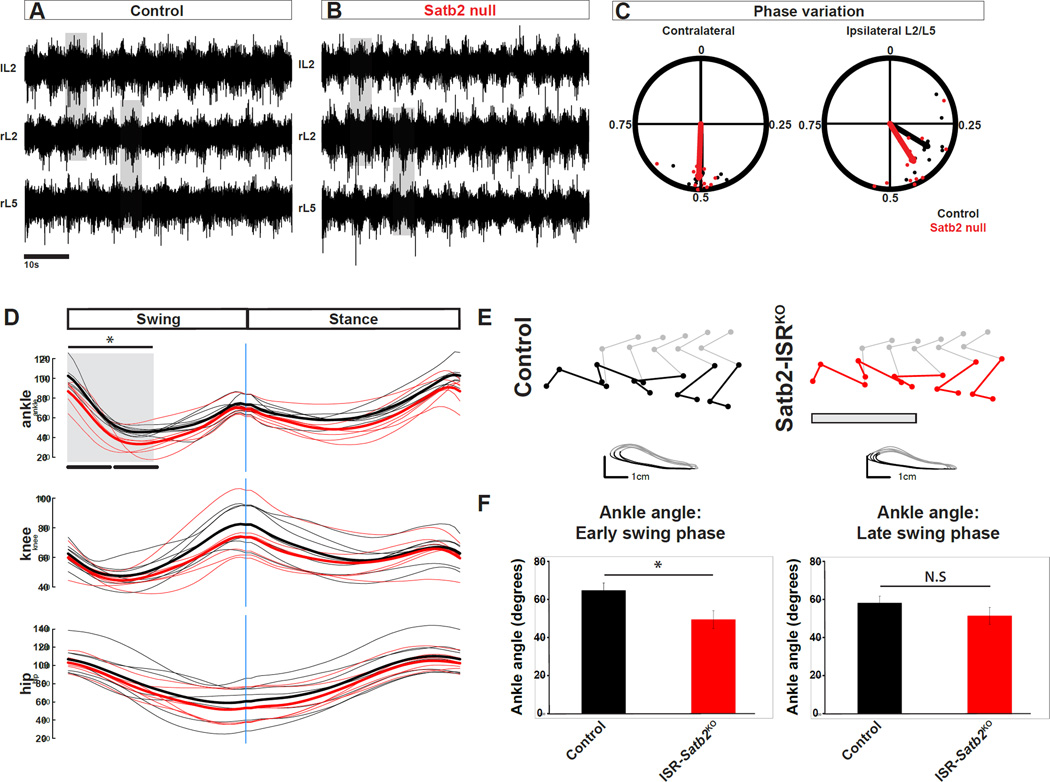
Figure 4. Motor output in response to loss of Satb2.
A, B. Example traces for left L2 (lL2), right L2 (rL2), and right L5 (rL5) ventral root recordings in control (A) or Satb2 null (B) spinal cords at e18.5. Neurochemically induced fictive locomotor activity in control spinal cords is characterized by alternating rhythmic bursts of motor neuron activity between contralateral L2 ventral roots and ipsilateral L2-L5 ventral roots. Neurochemical induction of fictive locomotor activity in Satb2 null spinal cords evokes rhythmic alternating bursts of motoneuron activity indistinguishable from wild type littermates. C. Quantification of phase analysis from contralateral and ipsilateral ventral root pairs reveals that fictive locomotor activity is normally coordinated in Satb2 null (red points) relative to wild type control littermates (black points). Points near 0.5 represent alternating activity. D. Kinematic analysis of the hindlimb during runway walking. Joint angle traces for ankle (top panel), knee (middle panel), and hip (bottom panel) are shown for swing and stance phases of a single gait cycle. Individual traces (average of two trials per individual) for control (black) and Satb2-ISRKO (red) are shown as dim lines, and average traces for each genotype are shown in bold. E. Representative stick diagrams and limb endpoint trajectories for control (left) and Satb2-ISRKO animals (right) Ankle angle is shown in color for control (black) and Satb2-ISRKO animals (red). Grey box in Satb2-ISRKO limb reconstructions shows an approximation for early swing phase (see also grey box in D, and quantification in left panel of F) where ankle hyperflexion is observed. In contrast, limb endpoint trajectories showing swing (grey) and stance (black) phases indicate normal movement of the foot marker. F. Ankle angle was significantly reduced in the first half of the swing cycle in Satb2-ISRKO animals. Ankle angle measurements are represented as mean +/− S.E.M. * indicates significant difference (p<0.05 for early swing phase); N.S indicates no significant difference. See also Figure S5.

