Figure 1.

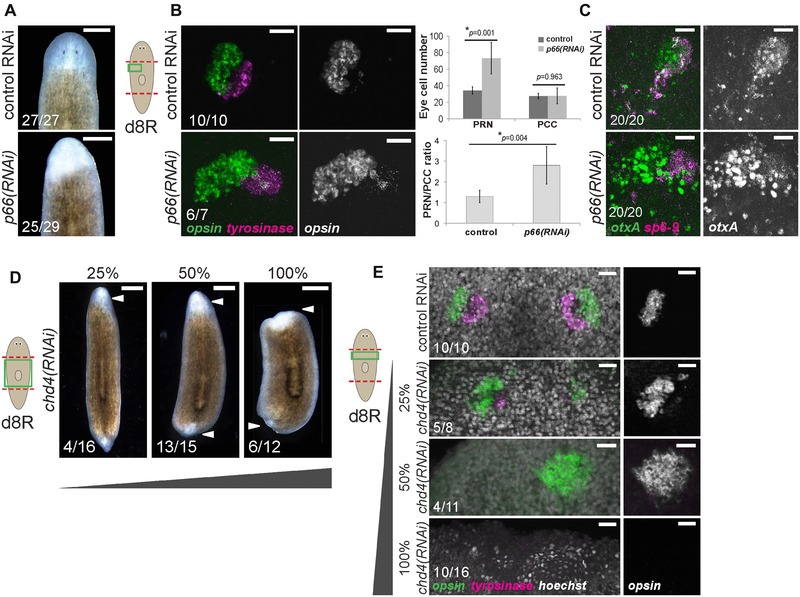
p66 and the NuRD complex suppress formation of photoreceptor neurons (PRNs) in regeneration. (A)−(C) p66 RNAi prevented formation of visible eyes but caused production of excess PRNs without affecting numbers of pigment cup cells (PCCs). (A) Images of live animals treated with p66 RNAi regenerated unpigmented blastemas with apparently no eyes. (B) In situ hybridization to detect PRN marker opsin and PCC marker tyrosinase after the indicated treatments, with quantification of eye cell numbers and PRN/PCC ratio shown to the right. Error bars show standard deviations from at least 10 eyes for each condition and P values were computed from two‐tailed t tests. (C) In situ hybridization to detect PRN progenitor marker otxA and PCC progenitor marker sp6‐9 after the indicated treatments. (D)−(E) Attenuated chd4 RNAi causes production of supernumerary PRNs. chd4, encoding a core component of the NuRD complex, is known to be required for blastema formation and survival due to its necessity in producing progenitor cells of the epidermal cell lineage. To circumvent this requirement and investigate possible functions related to eye formation, animals were fed with a mixture of bacteria expressing chd4 (as indicated) and control dsRNA to produce weakened effects of chd4 inhibition. (D) Images of live animals treated with chd4 RNAi failed to regenerate (6/12 animals) or regenerated very small blastemas (6/12 animals). Attenuated chd4 RNAi dosing formed no eye pigmentation (13/15 50% chd4 animals, 12/16 25% chd4 animals), no blastema pigmentation and failed to regenerate tails, reminiscent of effects of p66 RNAi. (E) Animals treated with 100% chd4 dsRNA failed to form a blastema or eyes (10/16 animals), but those treated with 50% or 25% dsRNA formed 1–2 eyes with excess PRNs (5/11 did not regenerate, 4/11 one enlarged opsin+ cluster, 2/11 two eyes 50% chd4 animals; and 5/8 two enlarged opsin+ clusters and few tyro+ cells, 3/8 two eyes 25% chd4 animals). (A)−(E) Scoring shown in the lower left of the panels indicates the number of animals presenting each phenotype versus total number examined. Cartoons show surgeries (red) and enlarged regions (green). Anterior, top. Bars: 300 μm (A), 25 μm (B, C, E), or 500 μm (D).
