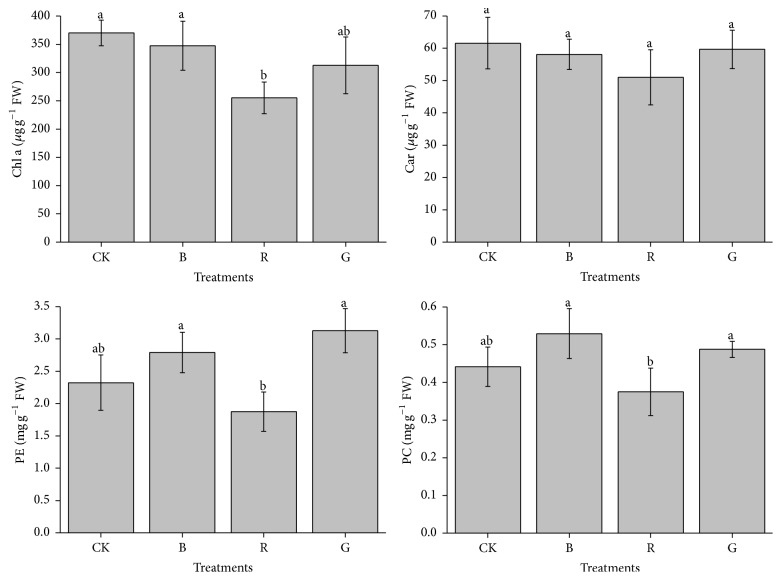
Figure 3.
Chlorophyll a (Chl a), carotenoid (Car), phycoerythrin (PE), and phycocyanin (PC) of Pyropia haitanensis as a function of the light source (comparison via ANOVA) during laboratory culture. Values are mean (±SD), n = 3. Different letters indicate statistical significance (P < 0.05). Error bars are standard deviations.

