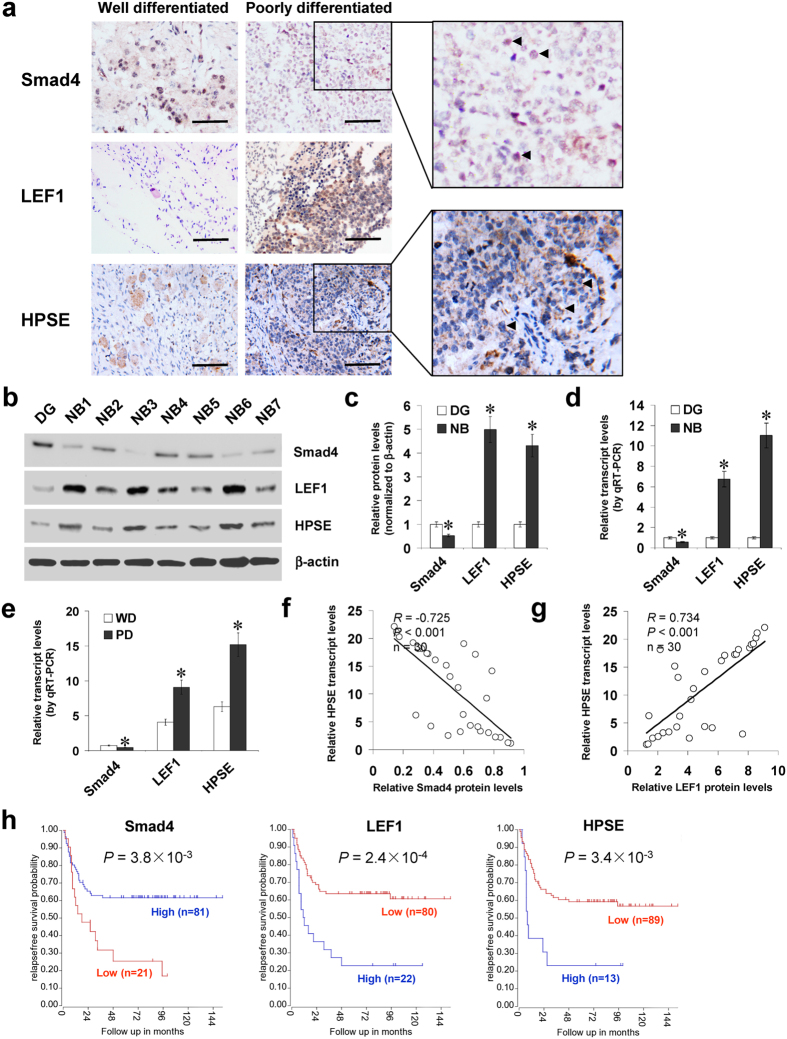
Figure 6. Smad4 and LEF1 are inversely or positively correlated with HPSE expression in NB tissues.
(a) immunohistochemical staining revealing the expression of Smad4, LEF1, and HPSE in NB specimens (arrowheads, brown). Scale bars: 100 μm. (b–d) western blot and real-time quantitative RT-PCR assays showing the protein and transcript levels of Smad4, LEF1, and HPSE in NB tissues (n = 30) and normal dorsal ganglia (DG). (e) real-time quantitative RT-PCR indicating the transcript levels of Smad4, LEF1, and HPSE in NB tissues with well (WD) or poor differentiation (PD). (f–g) the correlation between Smad4 protein, LEF1 protein, and HPSE transcript levels in NB tissues (n = 30). (h) Kaplan–Meier survival plots of 102 well-defined NB cases derived from R2 microarray analysis and visualization platform (http://r2.amc.nl) showing the survival probability of patients with high or low expression of Smad4, LEF1 or HPSE. *P < 0.01 vs. DG or WD.

