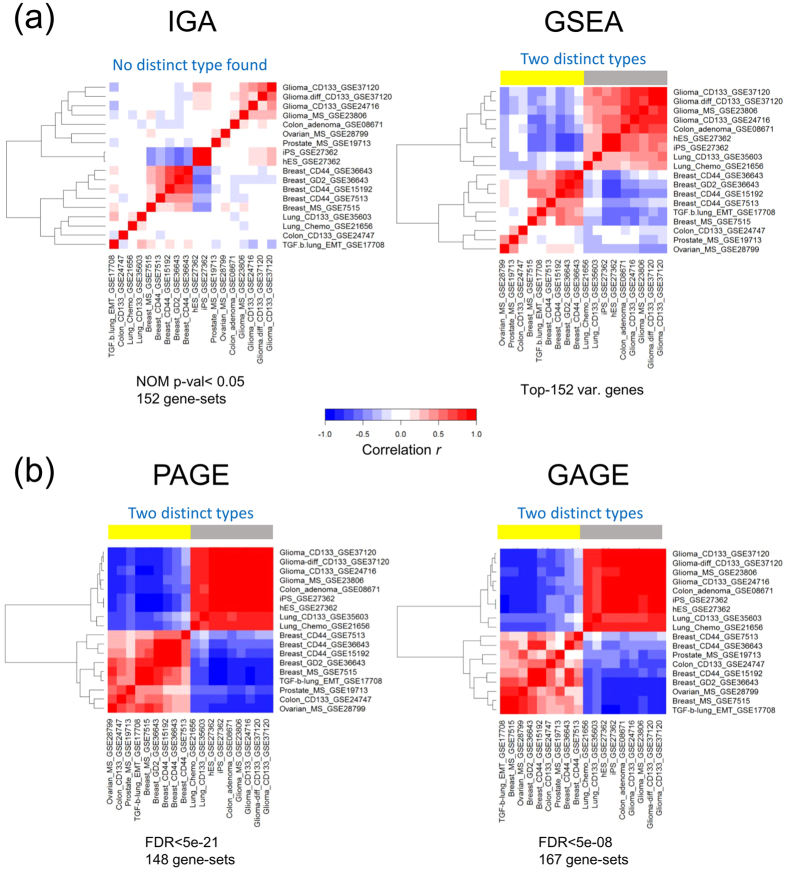
Figure 1. One-way clustering of 18 datasets.
(a) Left, in IGA, dataset represented by log2-ratios of 152 genes with the highest variance across datasets. Right, in GSEA, dataset represented by NESs of 152 most significantly enriched/depleted signatures (nominal p < 0.05 by GSEA algorithm). (b) Left, in PAGE, dataset represented by NNSs of 209 most significantly enriched/depleted signatures (FDR < 5e-18). Right, and GAGE (right), dataset represented by NESs of 197 most significantly enriched/depleted signatures (FDR < 5e-7). Clustering was based on Pearson correlation matrix (Methods).

