Figure 4.

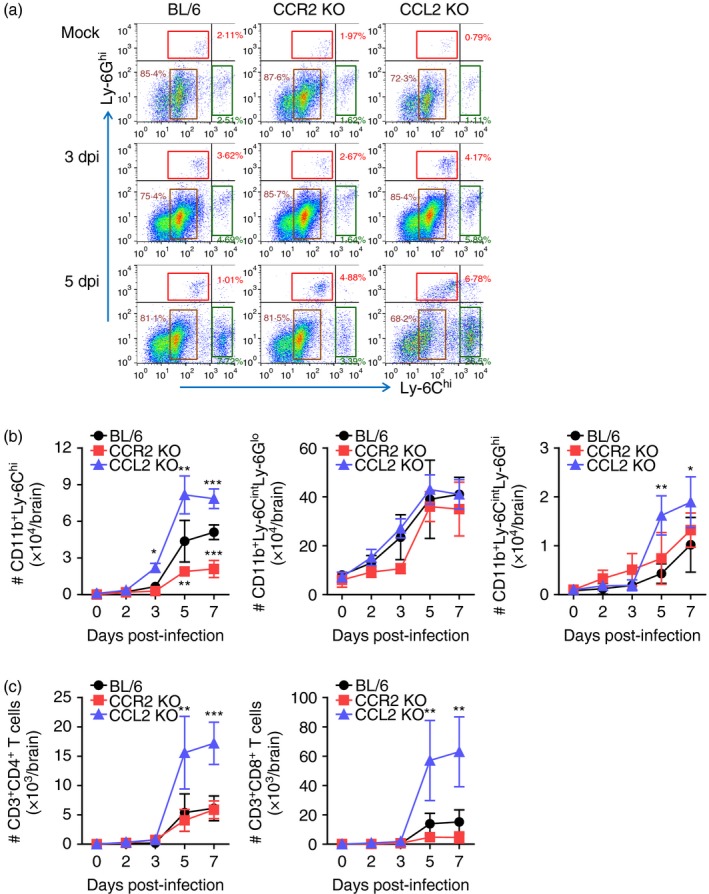
Enhanced accumulation of Ly‐6Chi monocytes in central nervous system (CNS) of CCL2 knockout (KO) mice. (a) Frequency of Ly‐6Chi monocytes and Ly‐6Ghi granulocytes in the brain. Frequency of Ly‐6Chi/Ly‐6Cint monocytes and Ly‐6Ghi granulocytes in the brain were determined by flow cytometric analysis at 3 and 5 days post‐infection (dpi). (b) Accumulated number of Ly‐6Chi/Ly‐6Cint monocytes and Ly‐6Ghi granulocytes in the brain. Accumulated number of Ly‐6Chi/Ly‐6Cint monocytes and Ly‐6Ghi granulocytes in the brain was kinetically determined by flow cytometric analysis from 2 to 7 dpi. Left graph, Ly‐6Chi monocytes; Middle graph, Ly‐6Cint monocytes; Right graph, Ly‐6Ghi granulocytes. (c) Accumulated number of CD3+ CD4+ and CD3+ CD8+ T cells in the brain. Values in representative dot‐plots denote average percentage of indicated cell population after gating on CD11b+ cells. Data in graph represent the mean ± SD of values derived from at least four mice per group. *P < 0·05; **P < 0·01; ***P < 0·001 compared between C57BL/6 and CCR2 KO or CCL2 KO mice.
