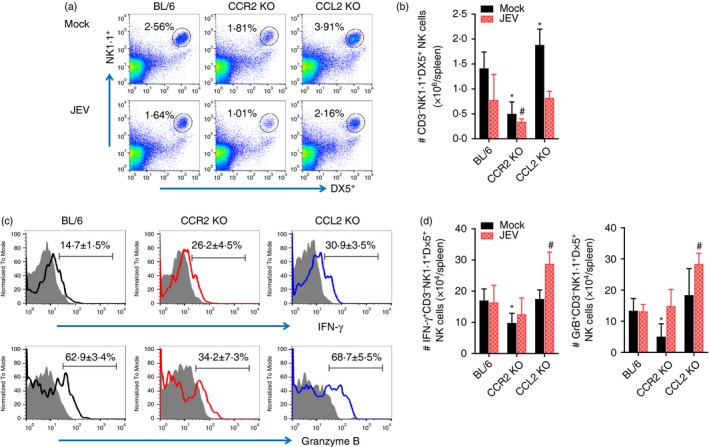
Figure 6.

Enhanced activation of innate natural killer (NK) cells in CCL2 knockout (KO) mice. (a,b) Frequency and absolute number of NK cells. Frequency and number of CD3− NK1·1+ DX5+ NK cells were determined by flow cytometric analysis using collagenase‐treated spleen at 2 days post‐infection (dpi). Values in representative dot‐plots denote average percentage of NK cells after gating on CD3‐negative cells. (c) NK cell activation. Activation of NK cells was evaluated by enumerating NK cells producing interferon‐γ (IFN‐γ) and granzyme B (GrB) using intracellular cytokine staining at 2 dpi. Values in representative histograms denote average percentage of cells producing IFN‐γ or GrB in CD3− NK1.1+ DX5+ NK cells. Bar graph shows the mean ± SD of values derived from at least four mice per group. *P < 0·05; **P < 0·01; ***P < 0·001 compared with levels of the mock‐infected BL/6 group. #P<0.05 compared with levels of JEV‐infected BL/6 group.
