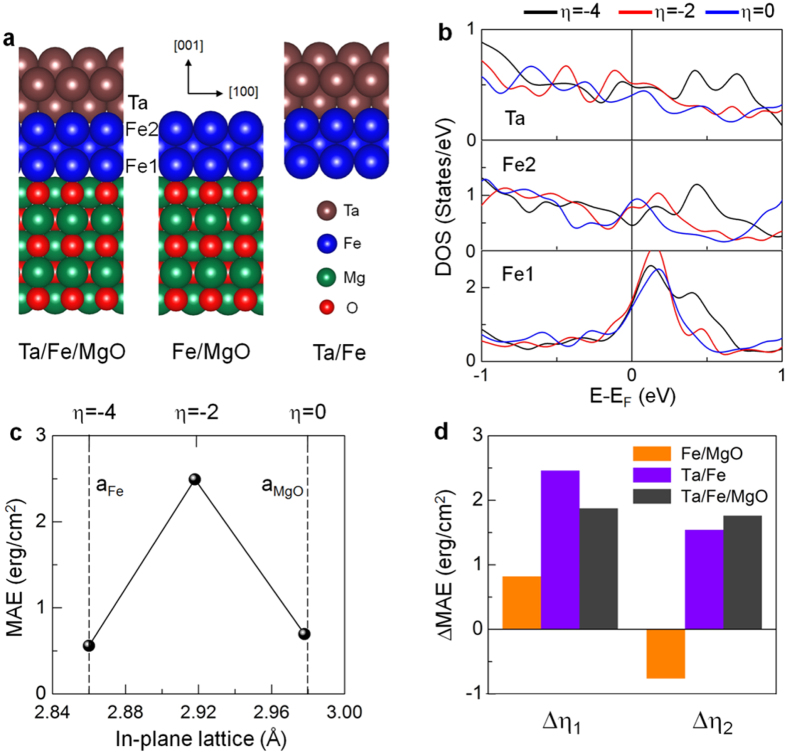
Figure 2.
(a) Side view of atomic structures for Ta|Fe|MgO (left), Fe|MgO without Ta (center), Ta|Fe without MgO layers (right). The larger brown, blue, green, and smaller red balls are Ta, Fe, Mg, and O atoms, respectively. The Fe atoms at the Fe|MgO and Ta|Fe interfaces are labeled by Fe(1) and Fe(2), respectively. (b) Density of states in the minority-spin state of the Ta (topmost), Fe(2) (center), and Fe(1) (bottommost panel) atoms for different strains of η = −4% (black), −2% (red), and zero (blue). The Fermi level is set to zero energy. (c) MAE of Ta|Fe|MgO for η = −4%, −2%, and zero strain. The vertical dashed lines indicate the experimental lattice constants of bulk Fe and MgO, which correspond to η = −4% and zero strain, respectively. (d) Strain-induced changes in MAE, ΔMAE(Δη1/η2) = MAE(η = −2%)–MAE(η = −4%/0), for the individual Fe|MgO (orange) and Ta|Fe (violet area) interfaces. Results of ΔMAE(Δη1/η2) for Ta|Fe|MgO are also shown in dark-gray for comparison.

