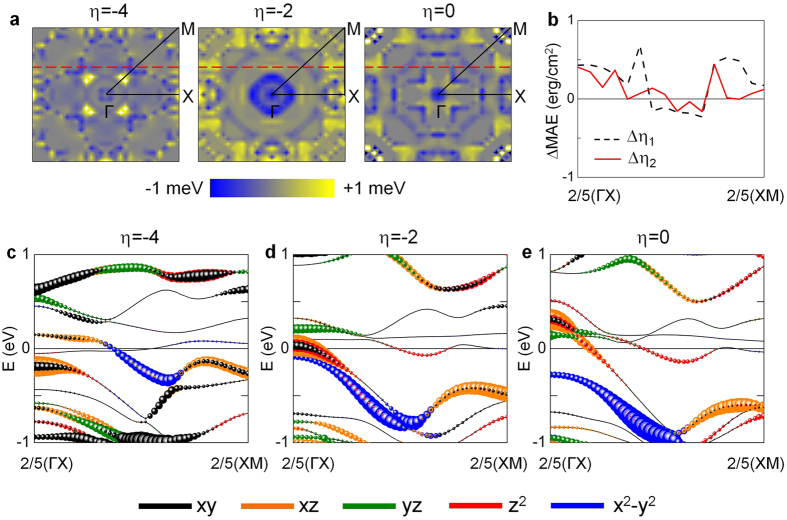
Figure 3.
(a) Distribution of MAE over k-space, MAE(k), for η = −4%, −2%, and zero strain (left to right). Blue/dark and yellow/light areas represent negative and positive MAE(k), respectively. The horizontal dashed lines indicate the k-point line that can represent the strain-induced changes of total MAE. (c) MAE(k) difference along 2/5(ΓX)–2/5(XM) between at η = −4% and η = −2% (dashed), and between at η = 0 and η = −2% (solid). Minority-spin band structures along the 2/5(ΓX)–2/5(XM) line for (c) η = −4%, (d) η = −2%, and (e) zero strain. The dxy, dxz, dyz, dz2, and dx2−y2 orbital characters of Ta atom at the Ta|Fe interface are denoted in black, orange, green, red, and blue, respectively. The symbol size represents the weight of the d orbitals. The Fermi level is set to zero energy.

